Introduction to the Awesome Oscillator:
The Awesome Oscillator is a popular technical indicator developed by Bill Williams and used to measure the momentum of a financial asset. Awesome Oscillator measures the market’s momentum by comparing the 34-period simple moving average (SMA) with the 5-period SMA, both calculated from the midpoint of each bar (High + Low )/2. This comparison creates a histogram that oscillates above and below a zero line, representing the bullish and bearish momentum, respectively.
Decoding the Awesome Indicator’s Histogram:
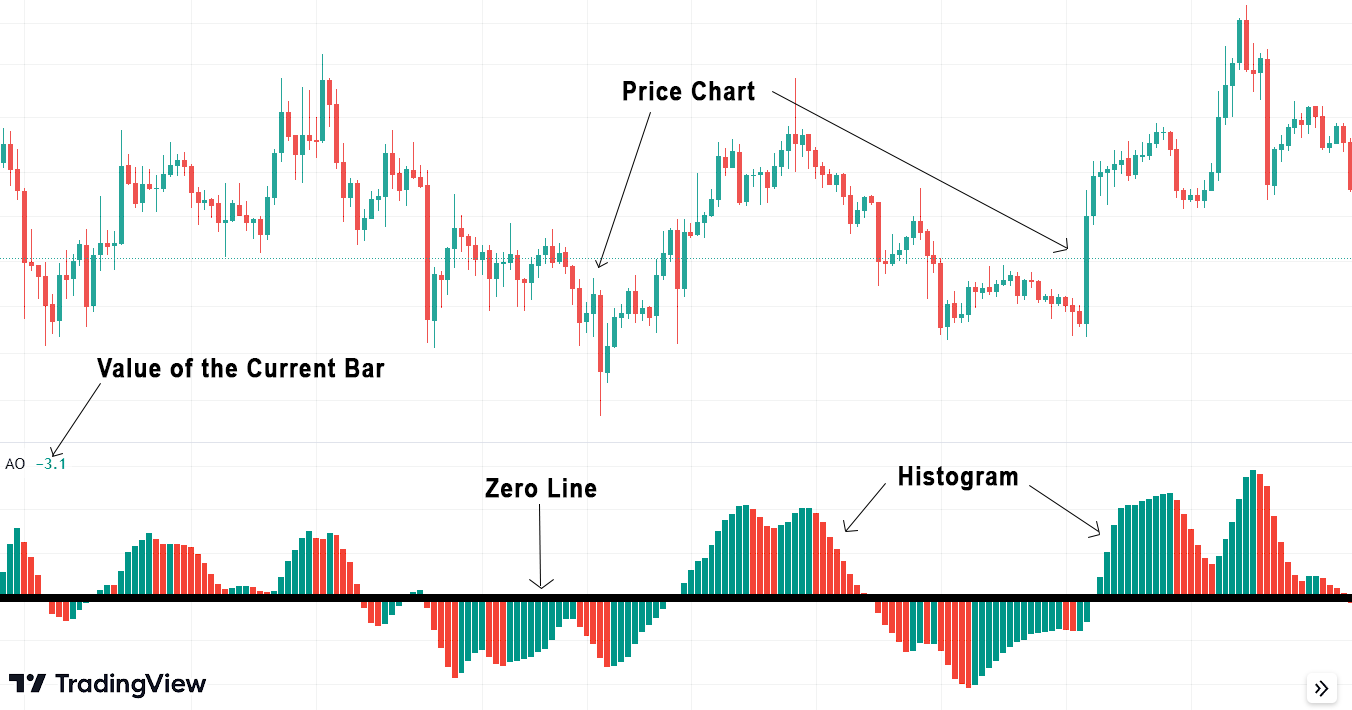
The histogram of this indicator comprises red and green bars. When the value of a bar is above the value of the previous bar, it is colored green. Conversely, if the value of the bar is below that of the previous bar, it is colored red.
The histogram of the Awesome Oscillator is a visual representation of the difference between the 5-period SMA and the 34-period SMA. When the 5-period SMA is positioned above the 34-period SMA, the difference is positive, and the histogram bars are plotted above the zero line. This occurrence typically indicates an uptrend in the market.
Conversely, when the 5-period SMA falls below the 34-period SMA, the difference becomes negative, and the histogram bars are plotted below the zero line. This situation is often associated with a downtrend in the market.
So green-colored bars plotted above the zero line indicate a strong uptrend, while red-colored bars below the zero line indicate a strong downtrend.
How the Awesome Oscillator is Calculated: Understanding the Formula:
The histogram represents the difference between 5 -period SMA and 34-period SMA.
The first 5-period SMA and 34-period SMA is calculated using Median Price –
Median Price = (High+Low)/2
Then calculate the difference between 5-period SMA and 34-period SMA –
Awesome Oscillator = SMA (Median Price, 5) – SMA (Median Price, 34)
Understanding the Signals Produced by the Awesome Oscillator:
- Zero Line Crossover: When the Awesome Oscillator crosses above the zero line, it signifies that the short-term SMA has crossed above the long-term SMA, indicating a shift towards bullish momentum. Conversely, when the oscillator crosses below the zero line, it suggests a shift towards bearish momentum as the short-term SMA falls below the long-term SMA.
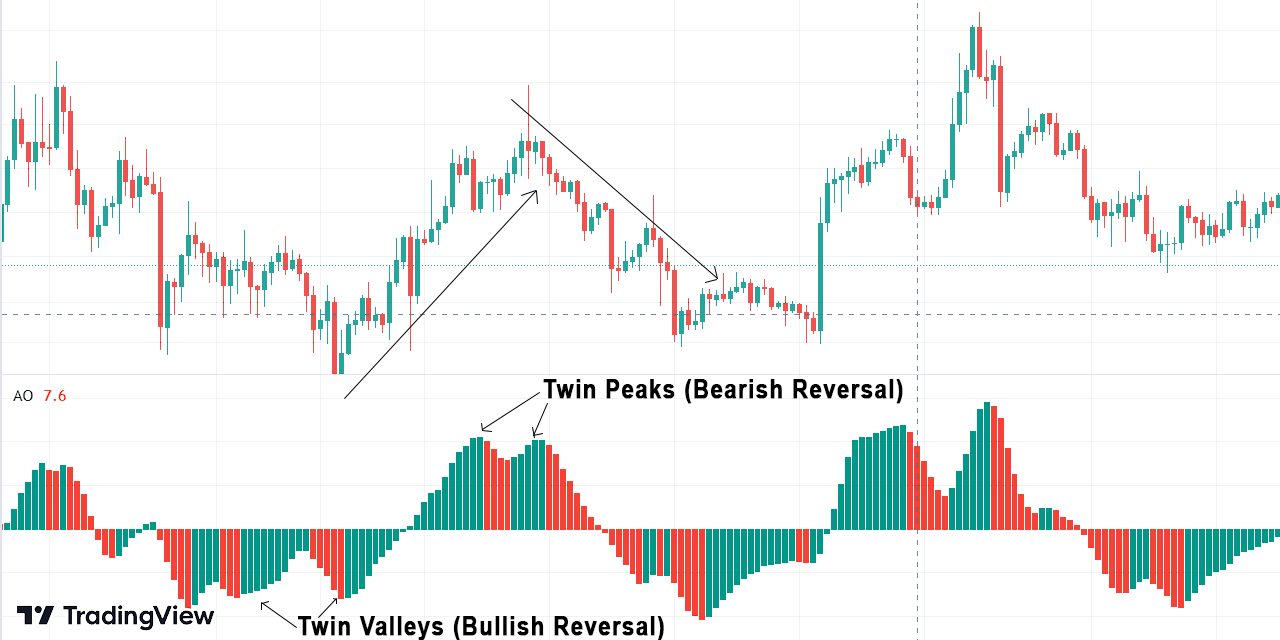
- Twin Peaks: The Awesome Oscillator’s twin peaks occur when two consecutive peaks appear above the zero line. This pattern suggests that the momentum of the uptrend is waning, and a possible bearish reversal. Similarly, “twin valleys” below the zero line signal a weakening downtrend and a possible bullish reversal.
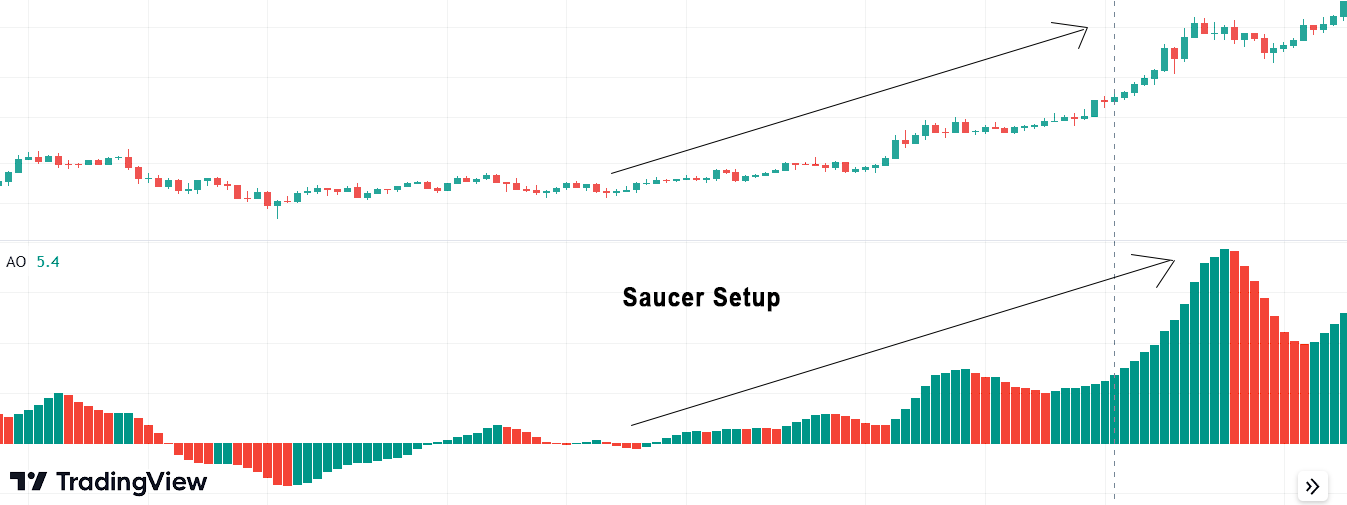
- Saucer Setup: A saucer setup in the Awesome Oscillator refers to the histogram transitioning from negative values to positive values in a gentle curve, resembling a saucer. This pattern indicates a shift from bearish to bullish momentum and often precedes a strong uptrend.
Trading Strategies with the Awesome Oscillator:
- Divergence Trading: Divergence occurs when the price trend and the histogram move in opposite directions. If the price forms higher highs, but the oscillator forms lower highs, it signals a potential trend reversal. Conversely, lower lows in price coupled with higher lows in the oscillator indicate a potential bullish reversal.
- Twin Peaks Confirmation: As mentioned earlier, the twin peaks pattern can indicate an impending trend reversal. Traders can confirm this signal by observing other technical indicators or chart patterns to reinforce their decision to enter or exit a trade.
- Zero Line Crossover Strategy: The zero line crossover provides valuable information about the momentum shift in the market. Traders can use this signal to enter or exit positions accordingly. For example, entering a long position when the oscillator crosses above the zero line and exiting when it crosses below.
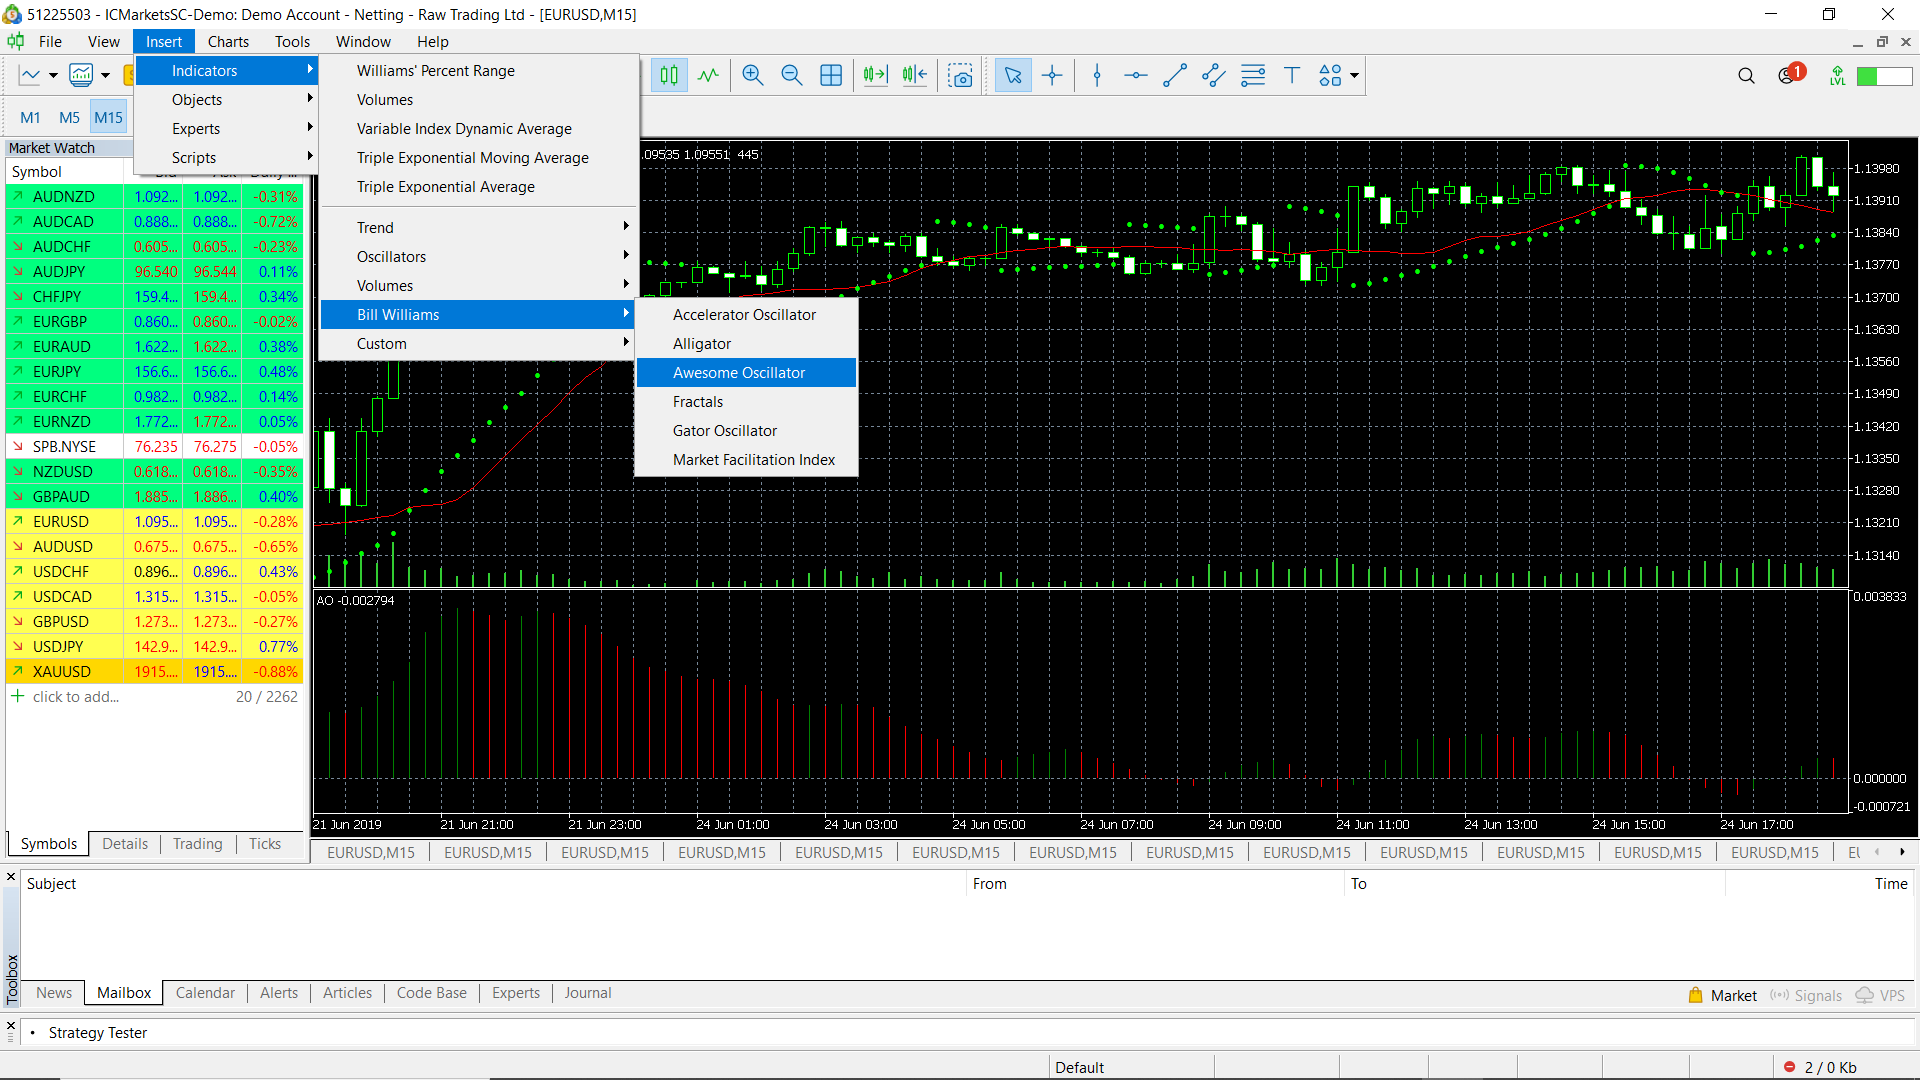
Using Awesome Oscillator with MetaTrader 5 (MT5):
Open Meta Trader. Then Insert > Indicators > Bill Williams > Awesome Oscillator
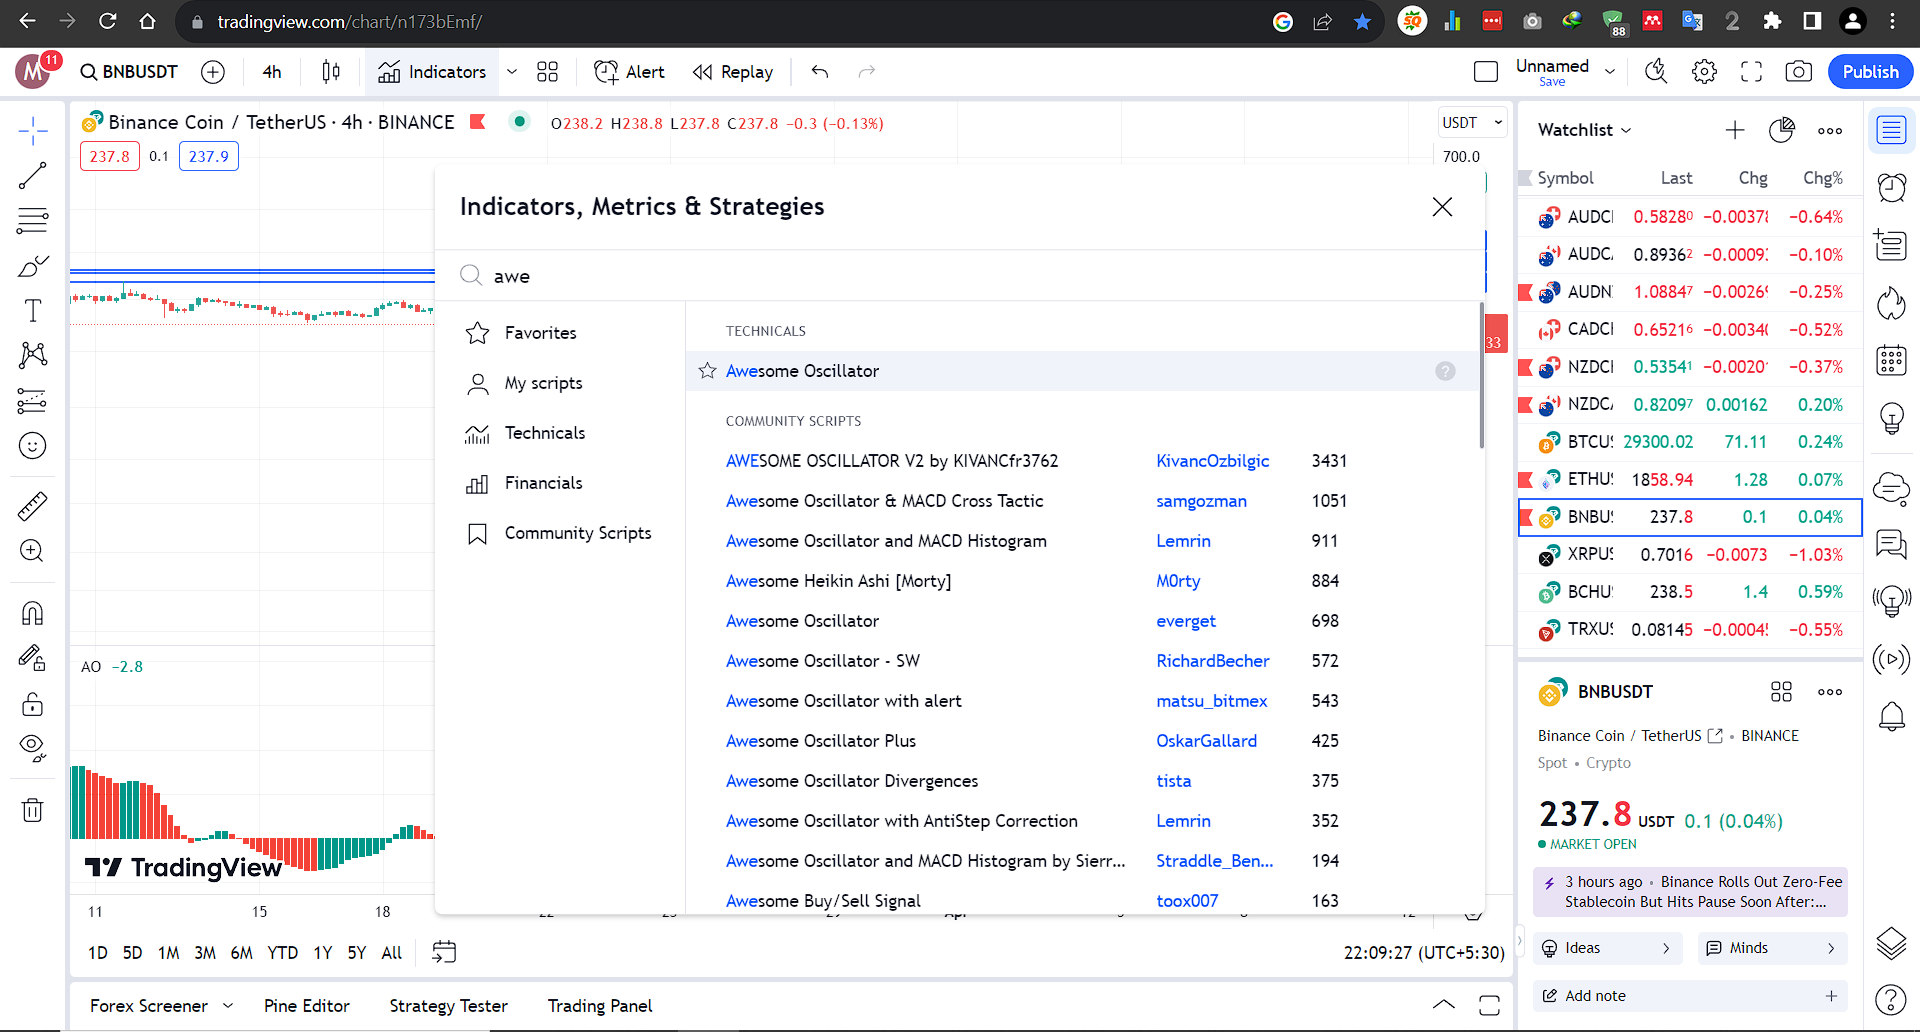
Using Awesome Oscillator with Tradingview:
Goto Indicators, then search for awesome Oscillator. Click on the name of indicator to insert it into chart
Conclusion:
The Awesome Oscillator is a powerful indicator that gives insights into market momentum and potential reversals. By understanding its key components and incorporating it into well-thought-out trading strategies, traders can enhance their decision-making process and make more informed trades. However, like any other technical indicator, it is essential to combine the Awesome Oscillator with other indicators and risk management techniques to achieve consistent success in the challenging world of trading.
Explore Our Algorithmic Trading Courses: