Introduction to Chaikin Money Flow (CMF) Indicator:
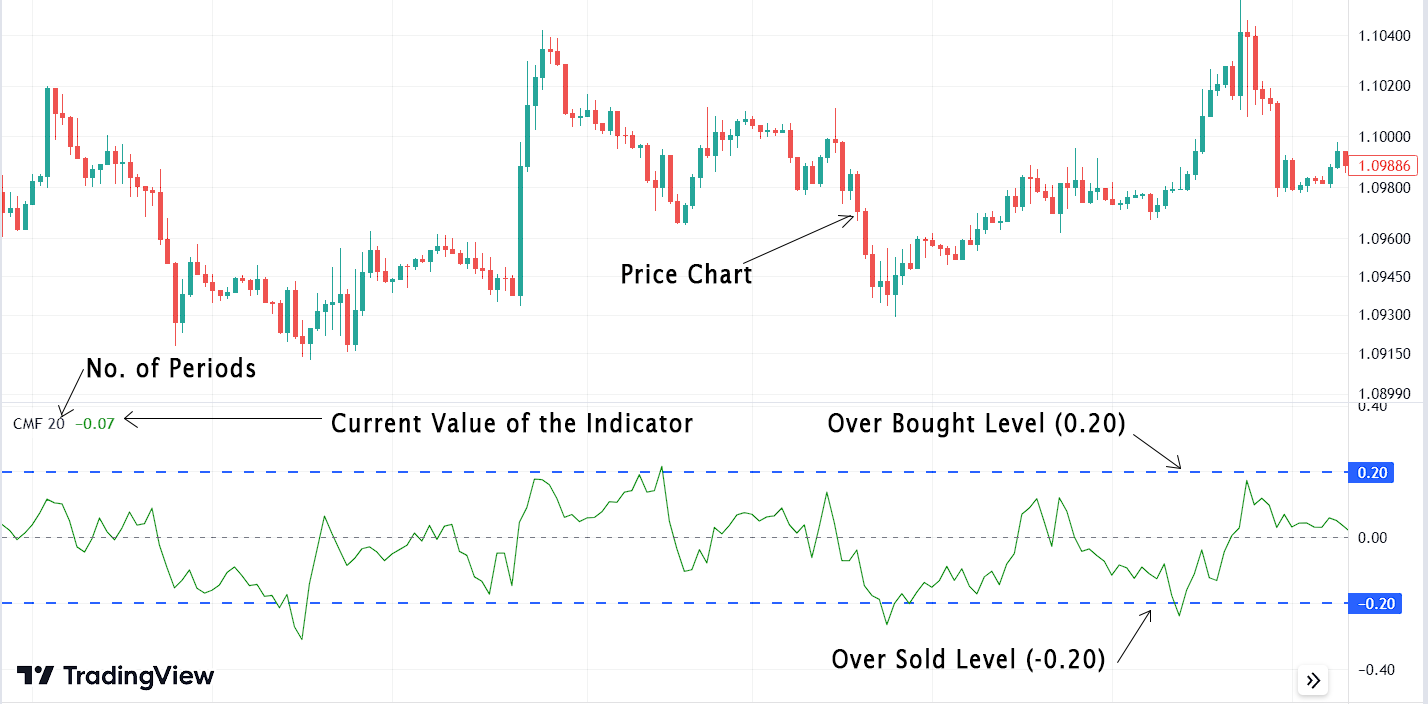
The Chaikin Oscillator is developed by Mark Chaikin. This oscillator measures the flow of capital into or out of an asset over a specific period of time, usually 20 or 21 periods. It consists of a single line that fluctuates around zero. Values above 0 indicate capital inflow into the asset, while values below 0 indicate capital outflow from the asset. This oscillator usually fluctuates between +0.5 and -0.5. Values above +0.20 indicate overbought conditions, while values below -0.2 indicate oversold conditions in the market.
Calculation of the Chaikin Money Flow – The Formula:
The Money Flow Multiplier is calculated as follows:
Money Flow Multiplier = [(Close – Low) – (High – Close)] / (High – Low)
Then Money Flow Volume is calculated:
Money Flow Volume = Money Flow Multiplier x Volume
The formula for calculating Chaikin Money Flow is as follows:
CMF = (Sum of Money Flow Volume for the Period) / (Sum of Volume for the Period)
Interpreting the Chaikin Money Flow Indicator:
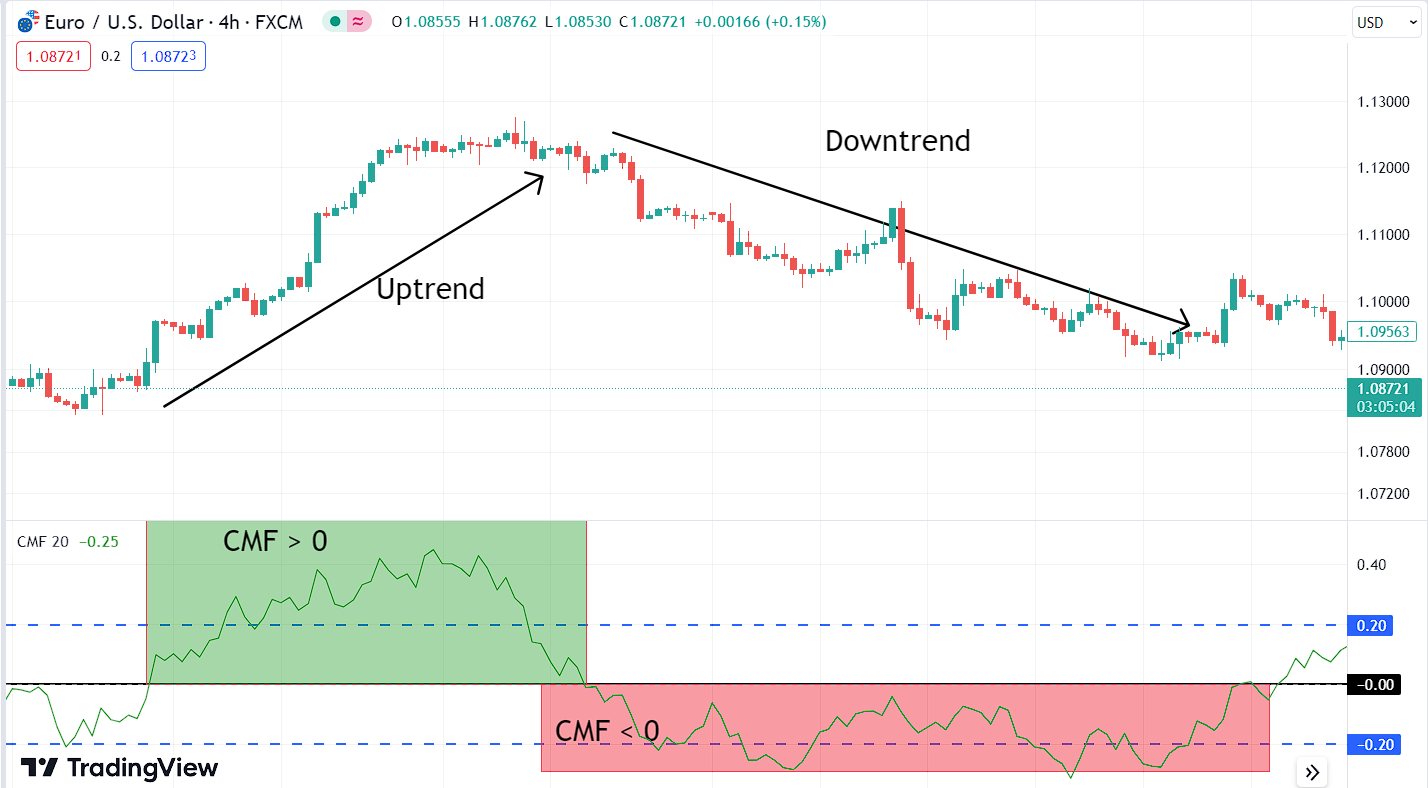
In this formula, “Close” refers to the closing price, “Low” is the lowest price of the period, and “High” is the highest price of the period. CMF values oscillate around a zero baseline. Positive CMF values indicate buying pressure, suggesting that the price closed higher than the midpoint of the day’s trading range with high volume. Negative CMF values suggest selling pressure, indicating that the price closed lower than the midpoint with high volume.
Trading strategies with the Chaikin Money Flow (CMF) indicator:
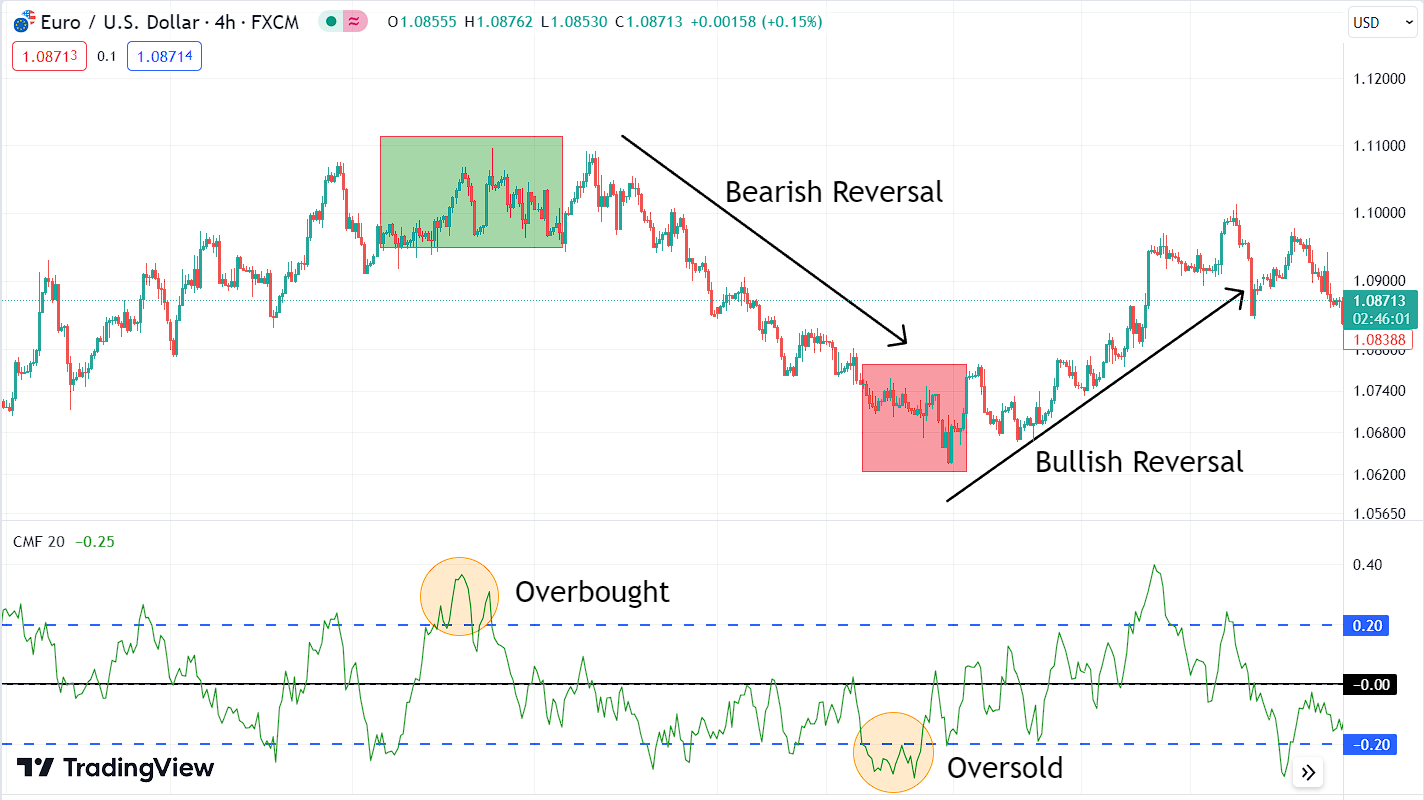
- Spotting Overbought and Oversold Conditions: When the value of the CMF indicator is above +0.2, it is usually considered an overbought signal, indicating that the current uptrend is likely to end and a potential bearish reversal may occur. Conversely, when the value of the CMF indicator falls below -0.2, it is typically regarded as an oversold signal, suggesting that the current downtrend is approaching its conclusion and a potential bullish reversal could be on the horizon. These signals gain greater reliability when applied to higher time frames (e.g., 4h).
- Spotting Divergence: Divergence in trading is a signal that occurs when the price of an asset doesn’t match the movement of an indicator. It can suggest a potential trend reversal or change in market direction. There are four types of divergence.
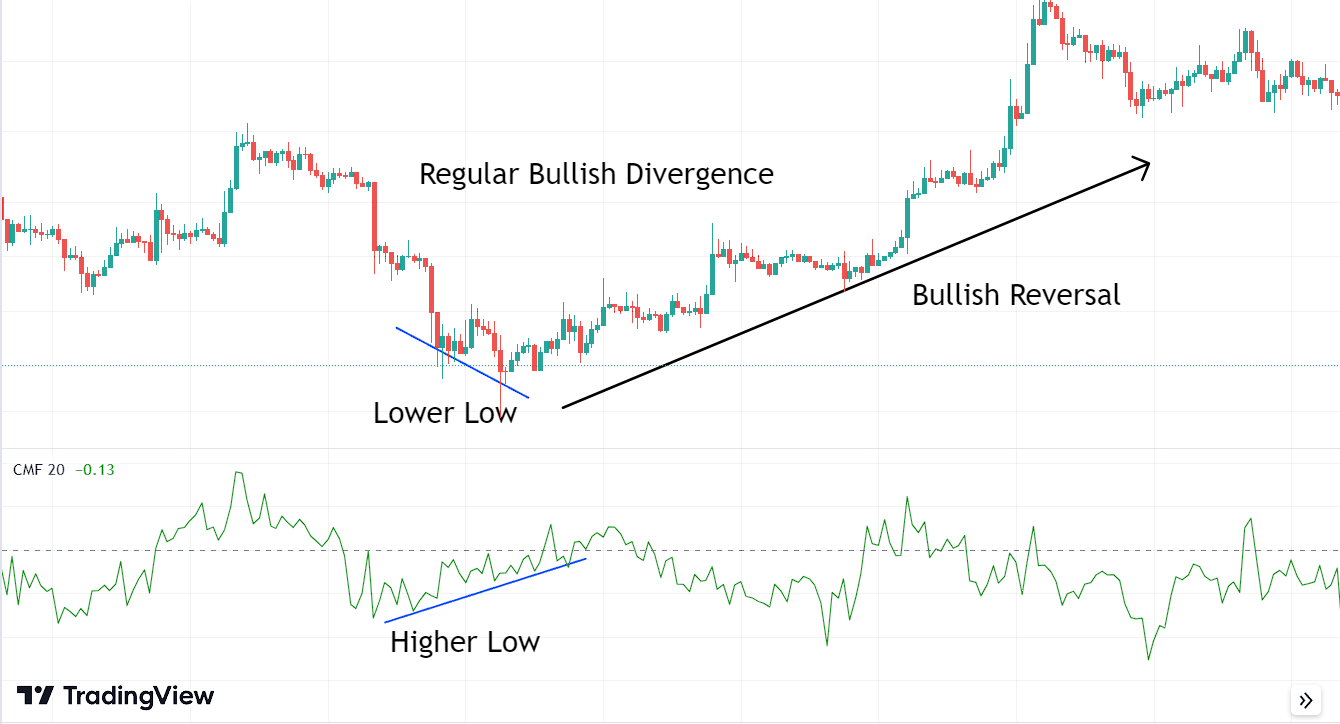
- Regular Bullish Divergence: This occurs when the price chart of the asset forms lower lows while the oscillator forms higher lows. This indicates that despite the downward momentum of the price, the selling strength is weakening, signaling a potential bullish reversal.
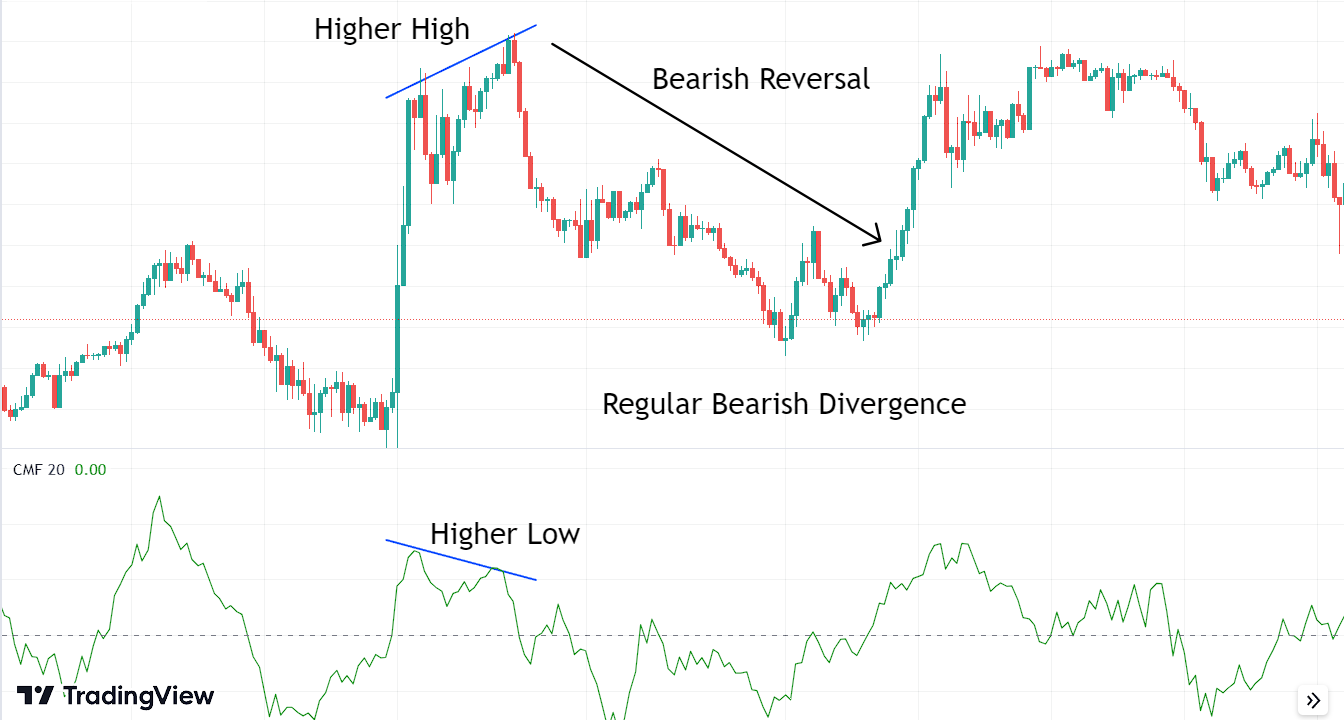
- Regular Bearish Divergence: This takes place when the price chart of the asset forms higher highs while the oscillator forms lower highs. It indicates that despite the upward momentum of the price, the buying strength is weakening, signaling a potential bearish reversal.
- Hidden Bullish Divergence: Bullish hidden divergence occurs when the price chart of an asset forms a higher low, while the oscillator forms a lower low. This indicates that even though the price is showing a temporary pullback or correction in an ongoing uptrend,the uptrend is likely to continue after the pullback.
- Hidden Bearish Divergence: Bearish hidden divergence occurs when the price chart of an asset forms a lower high, but the oscillator forms a higher high. This indicates that despite the price showing a temporary bounce or correction in an ongoing downtrend, the downtrend is likely to continue after the bounce.
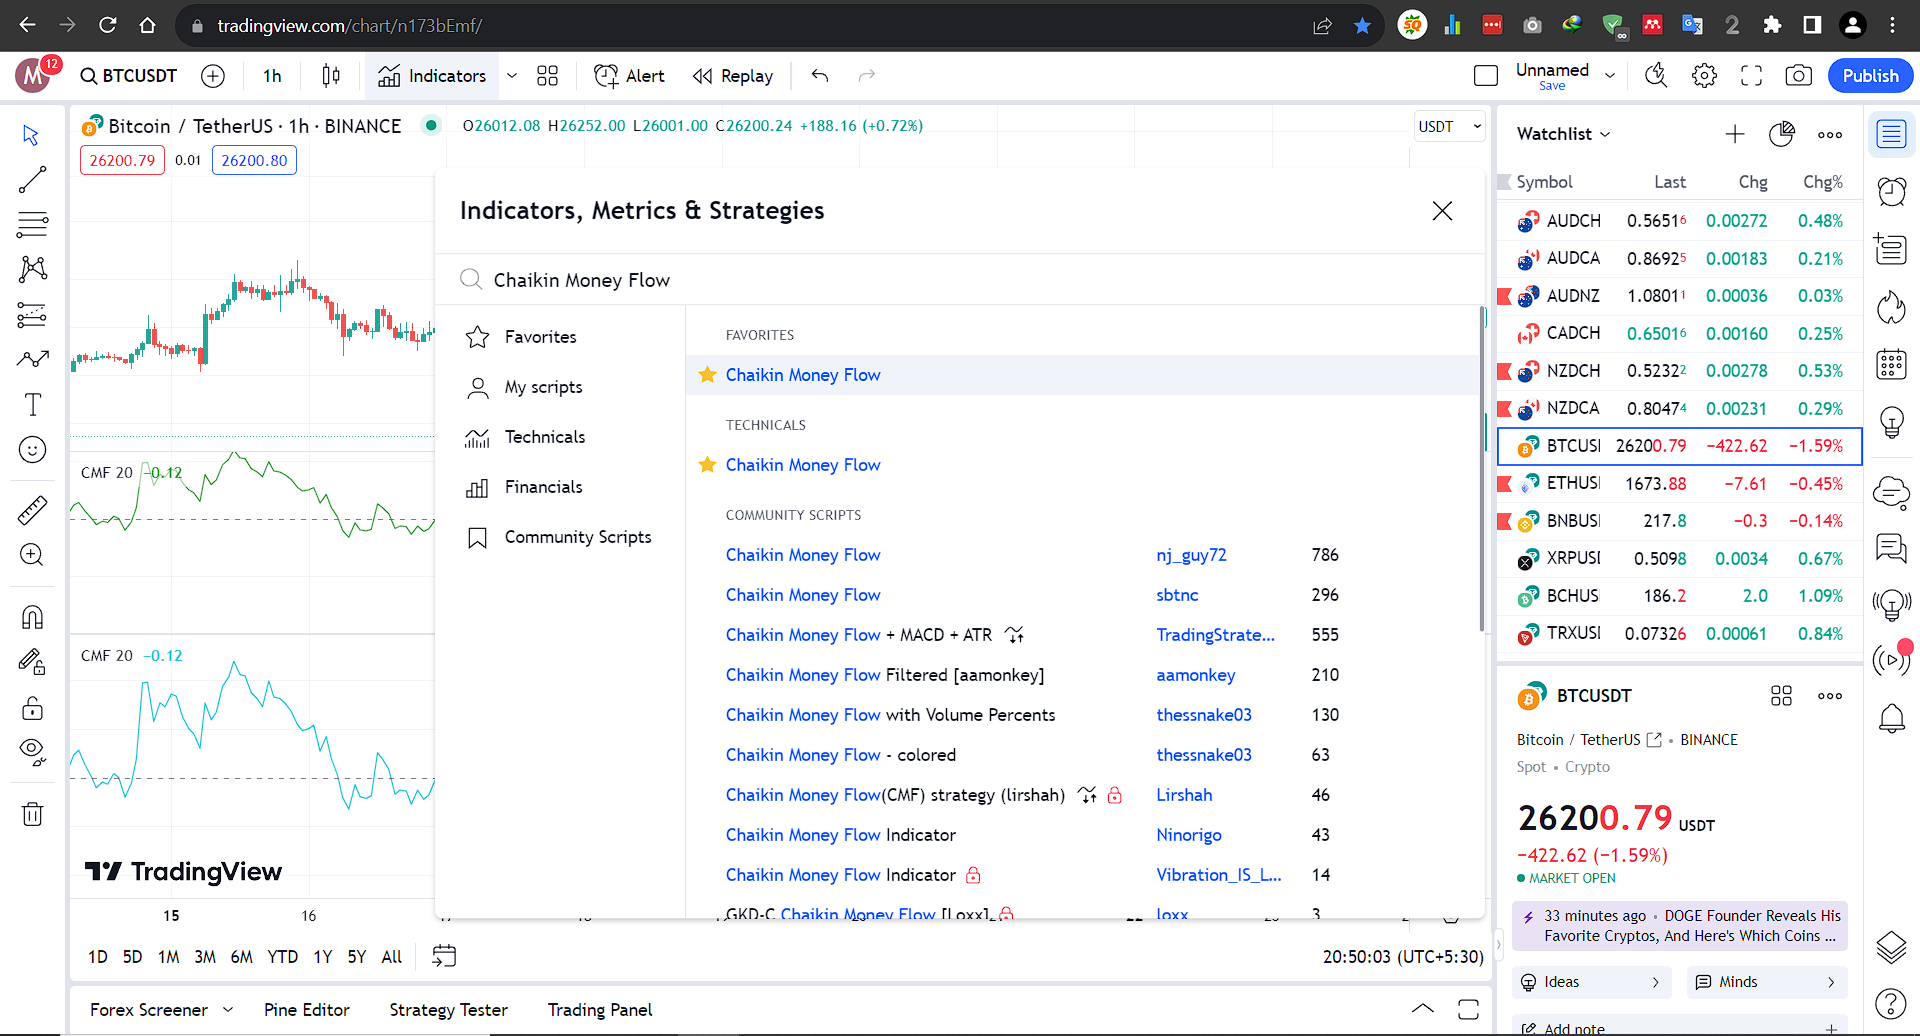
Using the Chaikin Money Flow (CMF) Indicator with TradingView:
Goto Indicators, then search for “Chaikin Money Flow” Click on the name of indicator to insert it into chart
Conclusion:
In conclusion, the Chaikin Money Flow (CMF) Indicator, reveals capital dynamics via price and volume. While not a foolproof solution, it uncovers trends and overbought/oversold conditions.
It is important to keep in mind that signals provided by the indicator are not always correct. It can also provide false signals. We can minimize the occurrence of false signals by combining this indicator with others and employing additional trading methods, such as support and resistance analysis, trendline breakouts, and more.”
Explore our Algorithmic Trading Courses: