Introduction to the Ease of Movement (EoM) Indicator:
The Ease of Movement indicator, developed by Richard W. Arms Jr. in the 1960s, operates as a volume-based oscillator that fluctuates around the zero line. It assesses the “ease” of price movement by taking into account both volatility of price and trading volume. Therefore, this indicator is particularly valuable for evaluating the strength of trends. Generally, when the indicator is above zero, it indicates that prices are advancing with relative ease, while a reading below zero suggests that prices are declining with relative ease. The degree of this “ease” is determined by the numerical value of the indicator.

Calculation of the Ease of Movement Indicator – The Formula:
The Ease of Movement indicator is calculated using the following steps and formulas:
- Distance Moved: Calculate the distance moved between the current period’s high and low prices and the prior period’s high and low prices. Distance Moved = ((Current High + Current Low) / 2) – ((Prior High + Prior Low) / 2)
- Box Ratio: Calculate the Box Ratio, which represents the volume-adjusted price range. Box Ratio = (Volume / 100,000,000) / (Current High – Current Low)
- 1-Period EMV (Ease of Movement Value): Divide the Distance Moved by the Box Ratio to calculate the 1-Period EMV. 1-Period EMV = Distance Moved / Box Ratio
- 14-Period Ease of Movement: Calculate the 14-Period simple moving average of the 1-Period EMV values. 14-Period Ease of Movement = 14-Period SMA of 1-Period EMV
Example Calculation: Let’s assume the following values for a 3-day period:
- Current High: 50
- Current Low: 45
- Prior High: 48
- Prior Low: 42
- Volume: 300,000
- Calculate Distance Moved: Distance Moved = ((50 + 45) / 2) – ((48 + 42) / 2) Distance Moved = 23
- Calculate Box Ratio: Box Ratio = (300,000 / 100,000,000) / (50 – 45) Box Ratio = 0.00003
- Calculate 1-Period EMV: 1-Period EMV = 23 / 0.00003 1-Period EMV = 766,666.67
Repeat these steps for the desired number of periods and then calculate the 14-Period Ease of Movement by finding the simple moving average of the 1-Period EMV values.
Significance of the EMV Value:
A relatively wide high-low price range combined with relatively low trading volume results in a smaller denominator (box ratio), yielding a higher EMV value. This indicates that a significant price movement was achieved with relatively minimal volume, highlighting an easy movement of price.
A narrow high-low price range accompanied by high trading volume leads to a larger denominator (box ratio), resulting in a lower EMV value. This suggests that even though the trading volume was substantial, the price movement was relatively limited, indicating a less easy movement of price.
Interpreting the Ease of Movement Indicator – Examples:
Example 01:
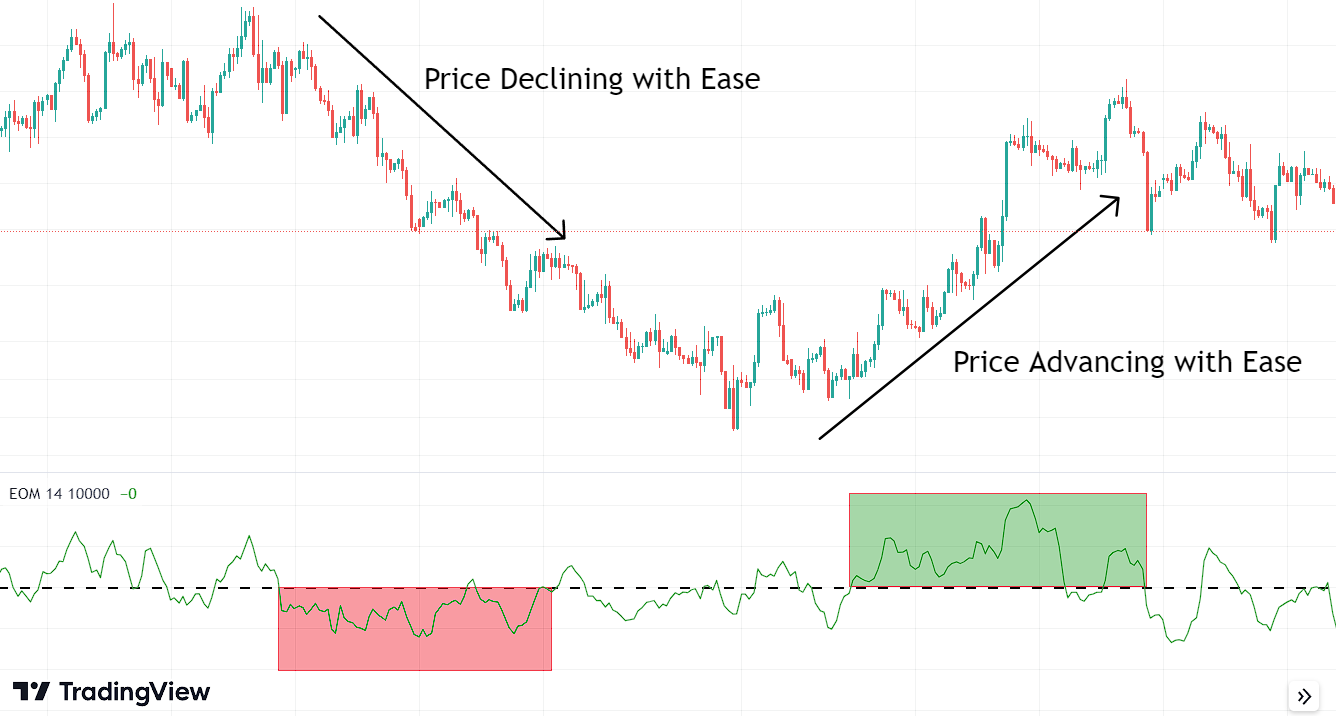
In the chart above, you can observe higher negative values of EMV in the red zone, indicating that a greater price movement was achieved with comparatively lower volume. This suggests that the price has declined with ease.
Similarly, you’ll notice higher positive EMV values within the green zone. These values signify that a substantial price movement was accomplished with relatively lower volume. This suggests that the price has risen with ease.
Example 02:

In this 2nd example, you can observe smaller values of EMV within the gray zone. This indicates that the price is unable to make a significant move even with higher trading volume.
Using the Ease of Movement Indicator with TradingView:
Goto Indicators, then search for “Ease of Movement” Click on the name of indicator to insert it into chart

Conclusion:
By measuring the “ease” of price movement, this volume-based oscillator assists traders and investors in gauging trend strength.While the EOM indicator provides insights into market behavior, it’s important to acknowledge its limitations, including its susceptibility to producing false signals during periods of low volatility or erratic trading volume. This indicator is at its best when used to confirm signals from other indicators. When it’s used alone, its potential is significantly reduced. It is also important to note that this indicator is more reliable in long-term trading.
Explore our Algorithmic Trading Courses: