Introduction to the Money Flow Index (MFI):
The Money Flow Index (MFI) is a volume-based oscillator that fluctuates between 0 and 100. It was developed by Gene Quong and Avrum Soudack in the early 1980s. It is also referred to as the Volume Weighted RSI and differs from the traditional RSI by considering both trading volume and price for its calculations.
It measures the inflow and outflow of money into and out from an asset. It can identify overbought and oversold conditions, as well as divergence. Values above 80 are usually considered overbought, while values below 20 are usually considered oversold.(Logue, 2011)

Calculating the Money Flow Index – The Formula:
- The calculation of the MFI involves several steps. The calculation begins by determining the typical price for the given period, which is the average of the high, low, and close prices. Typical Price = (High + Low + Close) / 3
- Then, the raw money flow is calculated by multiplying the typical price by the corresponding trading volume. Raw Money Flow = Typical Price * Volume
- Next, positive and negative money flows are distinguished based on whether the typical price is higher or lower than the previous period’s typical price.
- Positive Money Flow (PMF) is the sum of raw money flows on days when the typical price of current period is greater than the previous period’s typical price, while
- Negative Money Flow (NMF) is the sum of raw money flows on periods when the typical price is lesser than the previous typical price. (Note – If typical price is unchanged compared to previous value, then the Raw Money Flow is not used)
- The MFI is then calculated using the formula: MFI = 100 – (100 / (1 +( PMF / NMF)))
Example calculation:
Now, let’s calculate the MFI for Day 14 using the formula:
Here, for Day 14:
- Positive Money Flow (PMF) = $42,536,600
- Negative Money Flow (NMF) = $44,973,200
- MFI = 100 – (100 / (1 + (PMF / NMF)))
- MFI = 100 – (100 / (1 + (42,536,600/ 44,973,200)))
- MFI = 100 – (100 / 1.94)
- MFI ≈ 48.46
Interpreting the Value of the Money Flow Index (MFI):
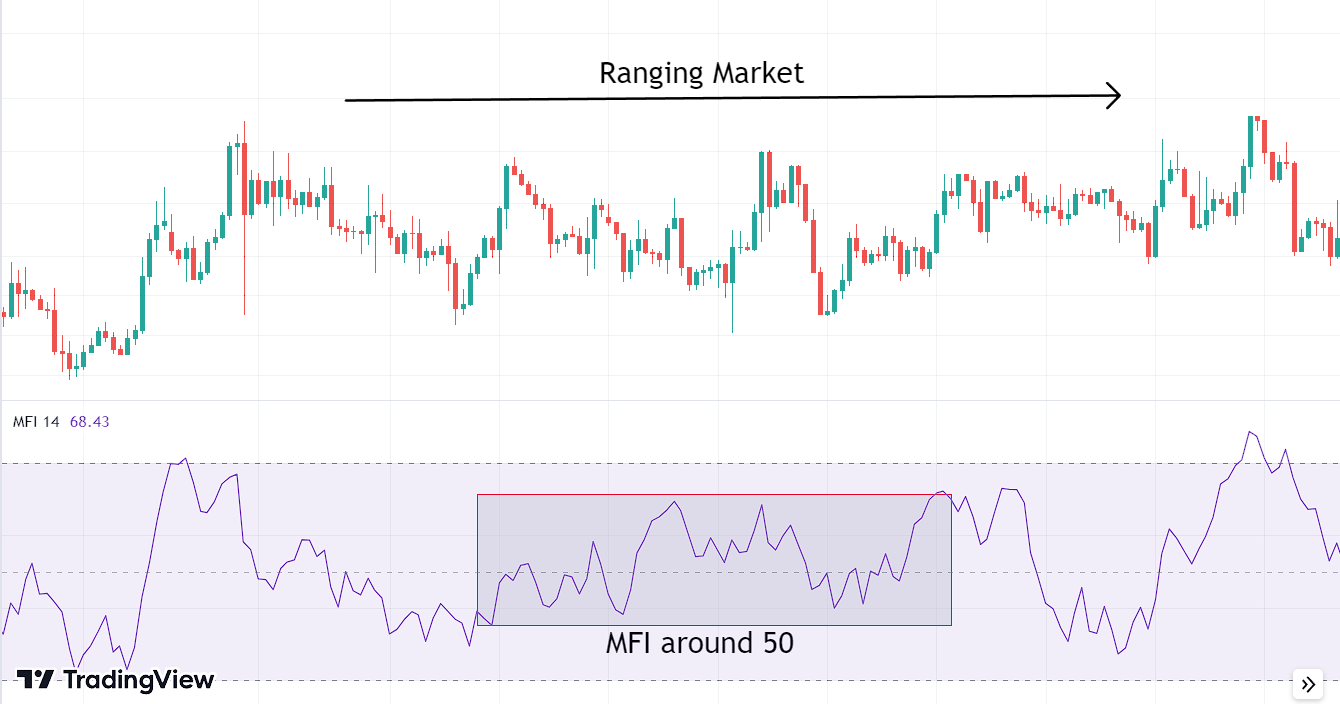
If the positive money flow is equal to the negative money flow, the money flow ratio (PMF/NMF) is equal to 1. In this case, the Money Flow Index (MFI) is equal to 50. This is true in ranging markets without upward or downward trend.
If the positive money flow is greater than the negative money flow, the money flow ratio (PMF/NMF) is greater than 1. In this case, the Money Flow Index (MFI) is greater than 50. This is true in markets with uptrend. (Asset is making higher typical prices continously with high volume)

If the positive money flow is less than the negative money flow, the money flow ratio (PMF/NMF) is less than 1. In this case, the Money Flow Index (MFI) is less than 50. This is true in markets with downtrend. (Asset is making lower typical prices continously with high volume)

Trading strategies with the Money Flow Index (MFI):
- Spotting Overbought and Oversold Conditions: When the value of the MFI indicator is above 80, it is usually considered an overbought signal, indicating that the current uptrend is likely to end and a potential bearish reversal may occur. Conversely, when the value of the MFI indicator falls below 20, it is typically regarded as an oversold signal, suggesting that the current downtrend is approaching its conclusion and a potential bullish reversal could be on the horizon. These signals gain greater reliability when applied to higher time frames (e.g., 4h).
- Spotting Divergence: Divergence in trading is a signal that occurs when the price of an asset doesn’t match the movement of an indicator. It can suggest a potential trend reversal or change in market direction. There are four types of divergence. In the following examples, you can see spotting divergence in EURUSD 1h time frame.
- Regular Bullish Divergence: This occurs when the price chart of the asset forms lower lows while the oscillator forms higher lows. This indicates that despite the downward momentum of the price, the selling strength is weakening, signaling a potential bullish reversal.

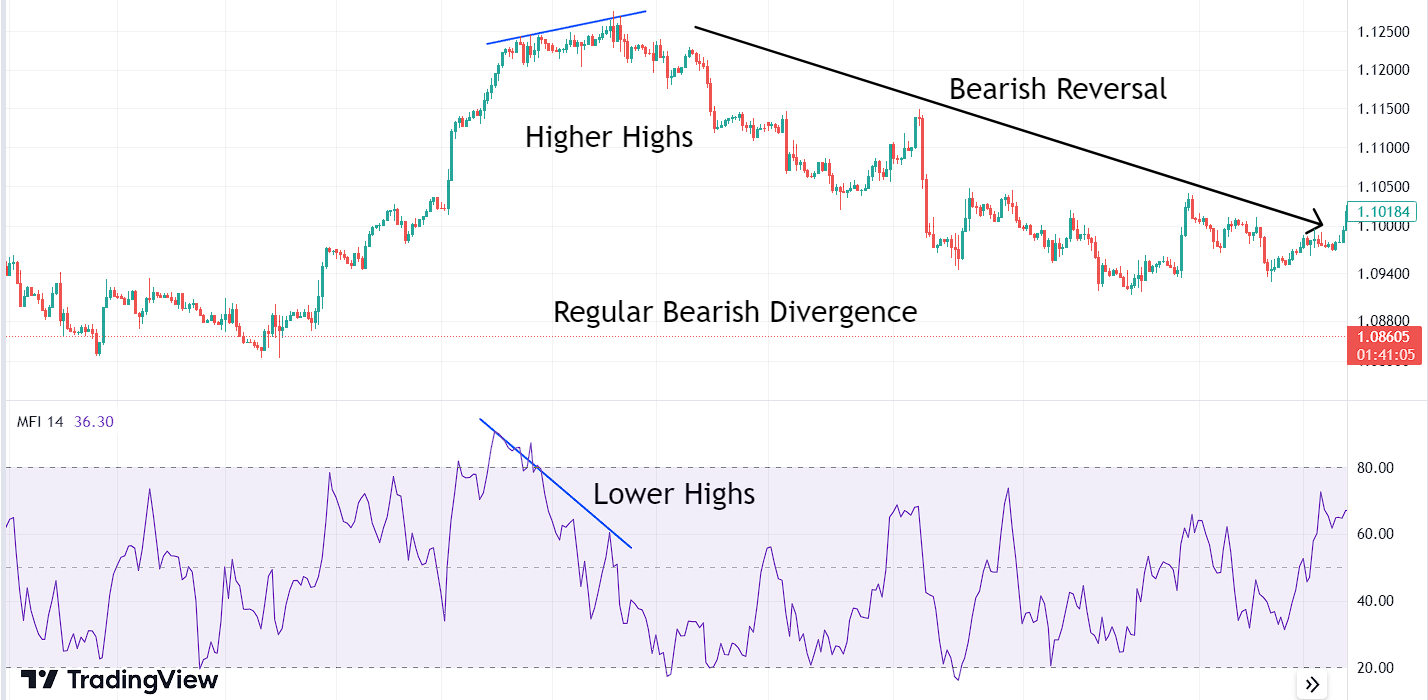
- Regular Bearish Divergence: This takes place when the price chart of the asset forms higher highs while the oscillator forms lower highs. It indicates that despite the upward momentum of the price, the buying strength is weakening, signaling a potential bearish reversal.
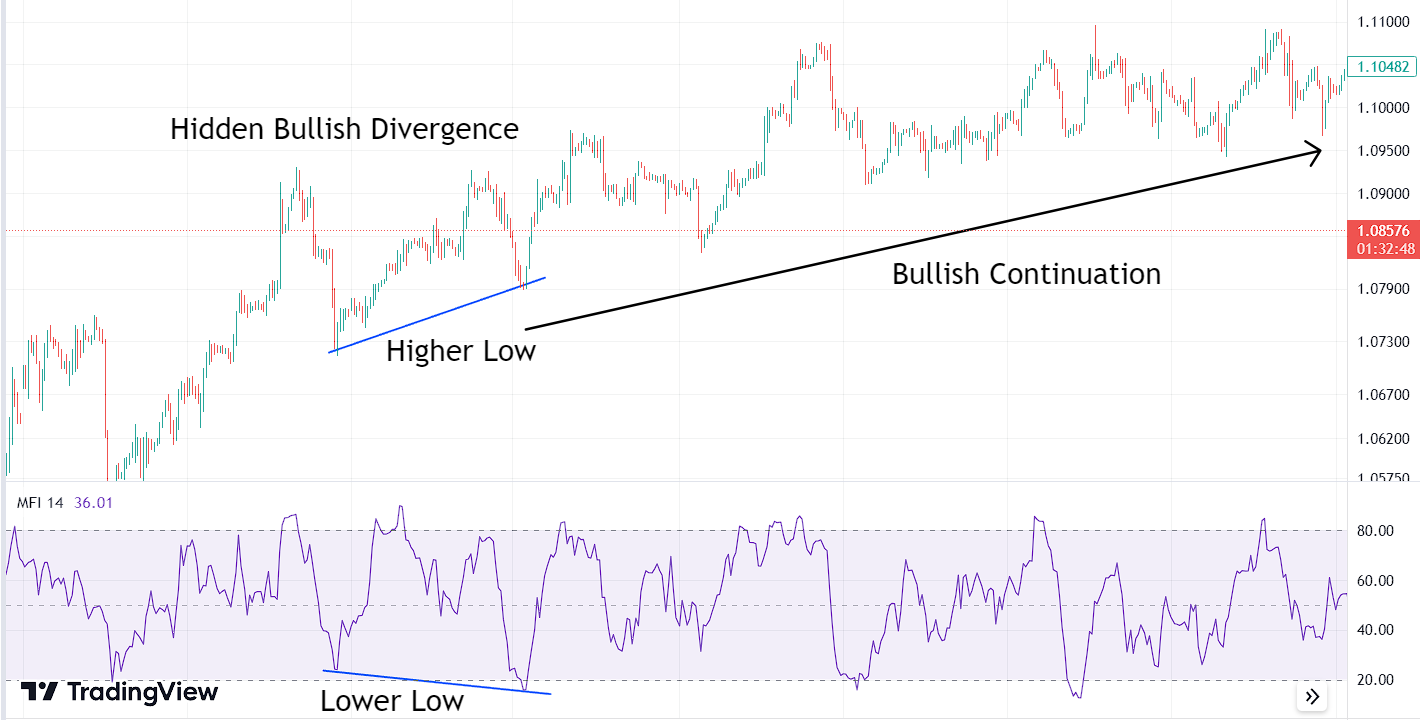
- Hidden Bullish Divergence: Bullish hidden divergence occurs when the price chart of an asset forms a higher low, while the oscillator forms a lower low. This indicates that even though the price is showing a temporary pullback or correction in an ongoing uptrend,the uptrend is likely to continue after the pullback.
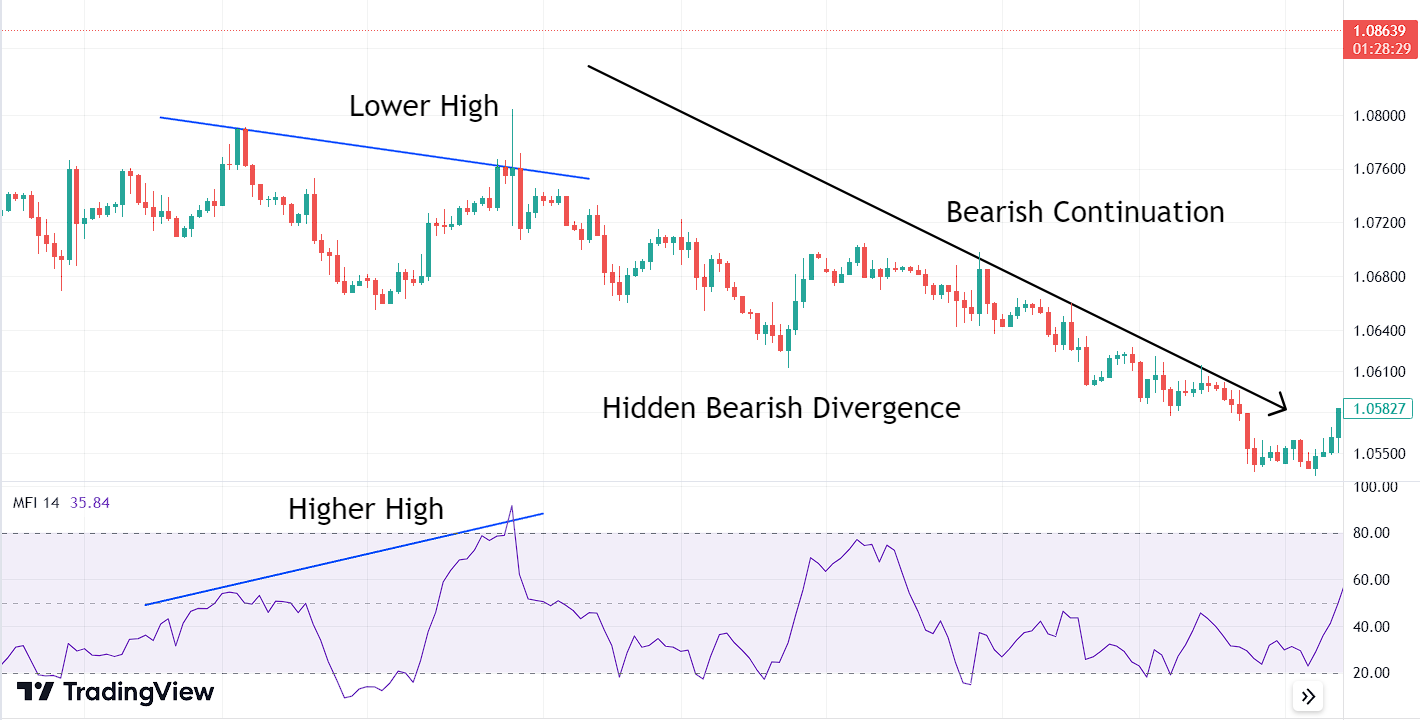
- Hidden Bearish Divergence: Bearish hidden divergence occurs when the price chart of an asset forms a lower high, but the oscillator forms a higher high. This indicates that despite the price showing a temporary bounce or correction in an ongoing downtrend, the downtrend is likely to continue after the bounce.
RSI vs Money Flow Index (MFI):
The main difference between RSI and the Money Flow Index is that the Money Flow Index uses volume in addition to price, whereas RSI uses only price. The overbought and oversold levels for RSI are 70 and 30, respectively, while for MFI, these levels are set at 80 and 20. Some traders believe that because MFI uses volume, it is a more leading indicator than RSI. Consequently, it can provide signals of potential reversals more promptly than RSI.
Using the Money Flow Index with TradingView:
Goto Indicators, then search for “Money Flow Index” Click on the name of indicator to insert it into chart

Using the Money Flow Index with MT5:
Goto Insert> Indicators > Volumes> Money Flow Index

Conclusion:
It is important to keep in mind that MFI is not a holy grail. Like every other indicator, MFI can produce false signals. Therefore, using other forms of technical analysis in combination is important to avoid these false signals.
References:
Logue, A. C. (2011). Day Trading For Dummies. Wiley.
https://books.google.com/books?id=tpOdM9LsAtcC&pg=PT196
Explore our Algorithmic Tradeing Courses: