Introduction to Negative Volume Index (NVI):
The Negative Volume Index is a volume-based technical indicator developed by Paul Dysart in the 1930s. This indicator is used to identify situations when smart money is active, based on changes in volume. It is based on the idea that ‘smart money’ (large institutional investors) tends to trade on days with low volume, while ‘noise traders’ (individual investors) tend to trade on days with high volume.
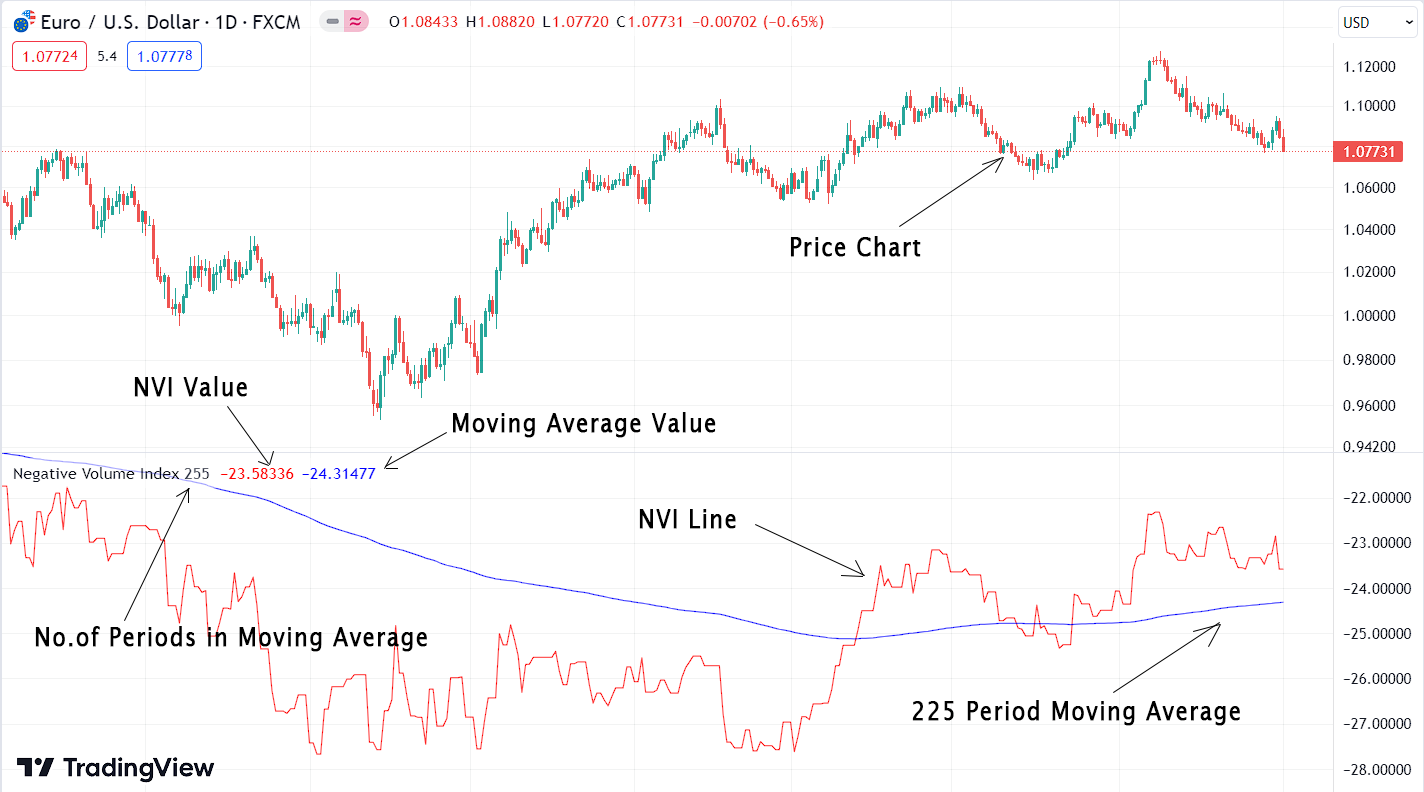
This indicator consists of two lines. The first line represents the Negative Volume Index (indicated in red color), and the second line represents the 255-period moving average of the NVI value (indicated in blue).
The Calculation of the Negative Volume Index – The Formula:
The calculation of the Negative Volume Index (NVI) involves taking the percentage change in price into account but with a specific condition: only days with a volume decrease are considered for NVI calculation. If the volume is equal or higher compared to the previous day, it is ignored. The formula for computing NVI with this condition is as follows:
NVI = Previous NVI + [(Percentage Change in Price) * (Previous NVI)]
To illustrate this formula, let’s consider an example:
Let the previous day’s NVI value be 100, and today’s closing price is $50, while yesterday’s closing price was $45. Additionally, today’s trading volume is 1,200,000 shares, and yesterday’s volume was 1,500,000 shares, indicating a volume decrease.
- Calculate the percentage change in price:
- Percentage Change in Price = [(Today’s Closing Price – Yesterday’s Closing Price) / Yesterday’s Closing Price] * 100
- Percentage Change in Price = [($50 – $45) / $45] * 100
- Percentage Change in Price = [($5 / $45) * 100
- Percentage Change in Price = (0.1111) * 100 Percentage Change in Price = 11.11%
- As there was a volume decrease from yesterday to today, we proceed with the NVI calculation:
- NVI = Previous NVI + [(Percentage Change in Price) * (Previous NVI)]
- NVI = 100 + [(11.11% * 100)] NVI = 100 + 11.11 NVI = 111.11
In this example, the NVI for the current day is calculated as 111.11, as there was a decrease in volume. The NVI only considers days with a volume decrease, making it a valuable tool to assess market sentiment and “smart money” involvement while ignoring days with higher or equal volumes.
Here, below, you can see another example:
| Date | Volume | Volume Change | Price Change(%) | NVI |
|---|---|---|---|---|
| 1 | 34 | – | 100 | |
| 2 | 29 | Down | +1.03% | 101.03 |
| 3 | 23 | Down | +0.35% | 101.38 |
| 4 | 30 | Up | 101.38 | |
| 5 | 35 | Up | 101.38 | |
| 6 | 30 | Down | +1.83% | 103.24 |
| 7 | 31 | Up | 103.24 |
Now, in the chart below, you can see that the NVI indicator only changes when there is a fall in volume. It does not change when there is rising volume. (Chart: EURUSD 4H):

Trading Strategies with the Negative Volume Index:
When analyzing trends with the Negative Volume Index, it is important to use higher time frames to improve accuracy (e.g., 1D or 1W). If the current value of NVI is above the moving average of NVI, that means smart money has been buying, and the price of the asset should head higher. If the current value is below the moving average, smart money has been selling, and the price should head lower.
According to past data, when the weekly NVI is above the average, the odds favor a major bull market with better than a 95 in 100 chance. When NVI is below the moving average, the odds lean somewhat more than 50 in favor of a bear market. Therefore, NVI is considered a bull market indicator.
Trend of NVI | Probability that a Bull Market in Progress | Probability that a Bear Market in Progress |
|---|---|---|
| Up | 96% | 4% |
| Down | 47% | 53% |

Negative Volume Index (NVI) vs Positive Volume Index (PVI):
The opposite value of the negative volume index is called the positive volume index (PVI). It measures market changes only when there is rising volume. This indicator is a better bear market indicator than the negative volume index.
Trend of PVI | Probability that a Bull Market in Progress | Probability that a Bear Market in Progress |
|---|---|---|
| Up | 79% | 21% |
| Down | 33% | 67% |
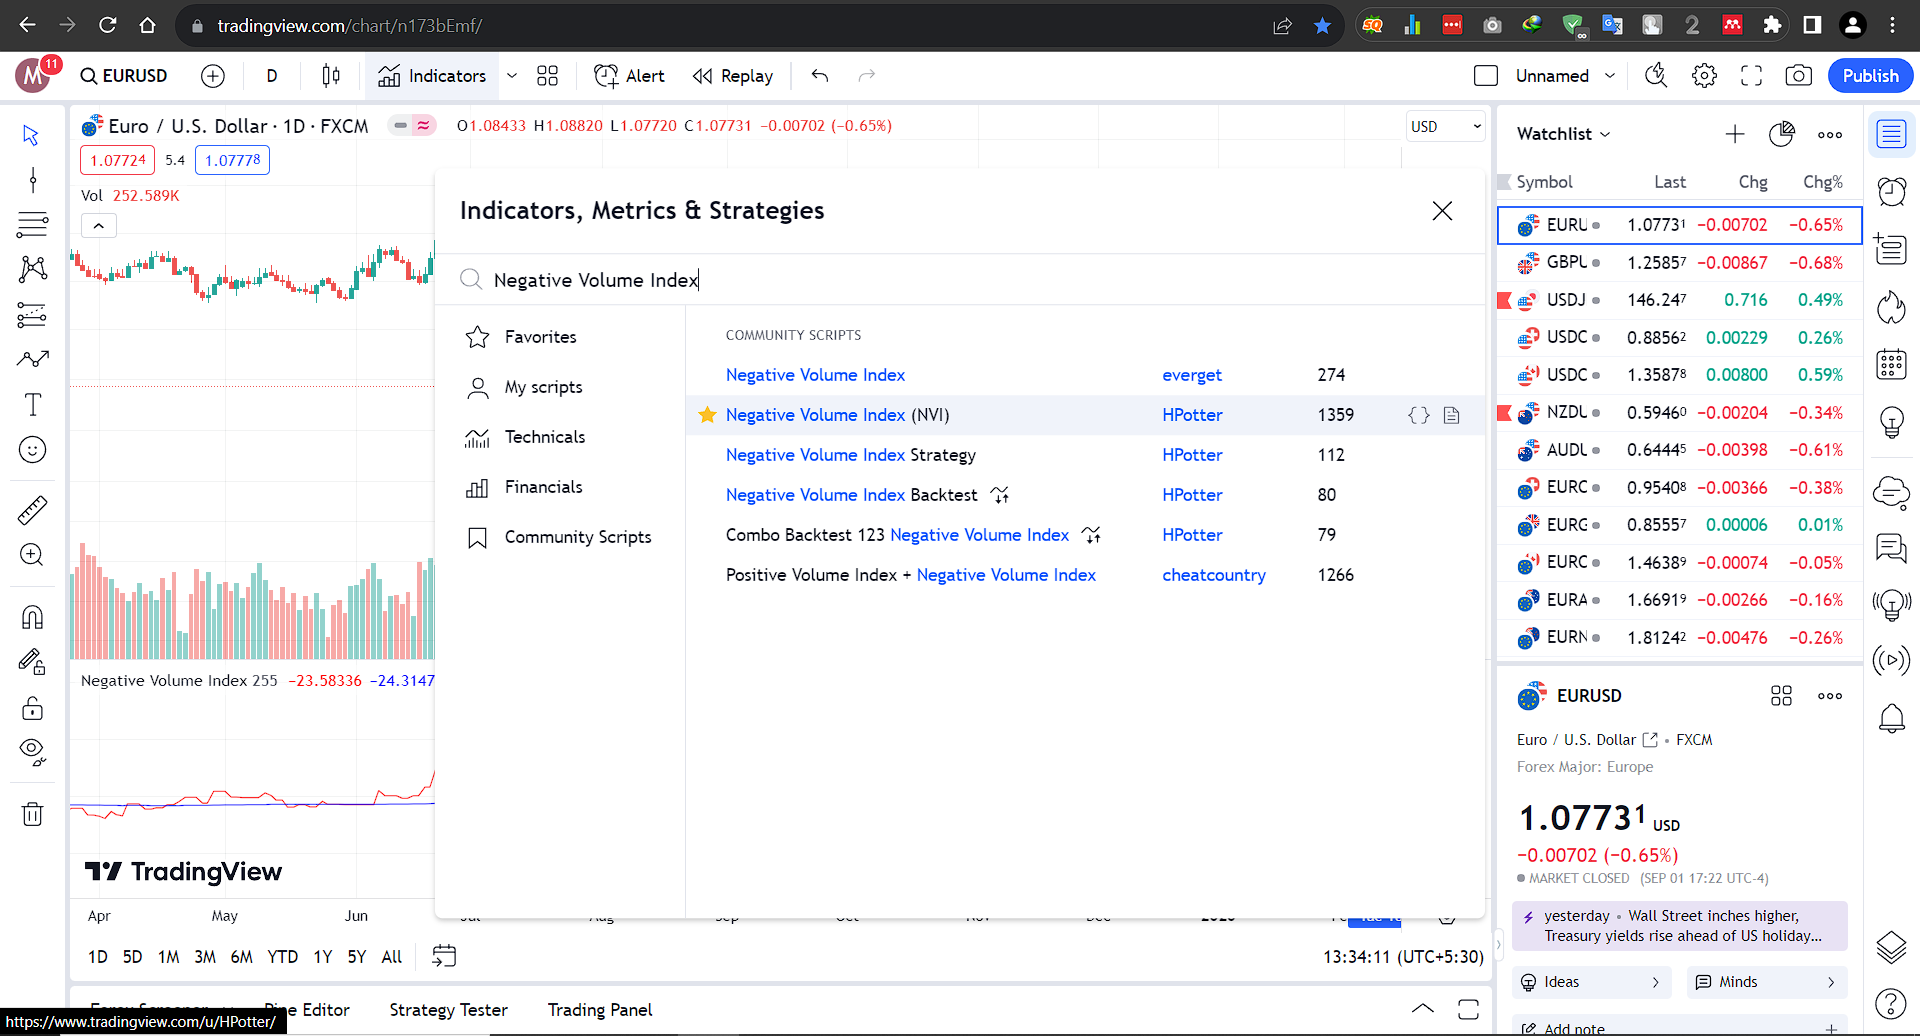
Using Negative Volume Index with the Tradingview:
Goto Indicators, then search for “Negative Volume Index” Click on the name of indicator to insert it into chart
Conclusion:
The negative volume index measures price changes only when there is falling volume. If the price of the asset increases with falling volume, NVI will increase. If the price of the asset decreases with falling volume, NVI will decrease. If the price of the asset increases or decreases with either a rise or no change in volume, NVI will not change. It is important to keep in mind that NVI works best with market indices like the S&P 500 and Dow. It is also important to use it with other indicators and trading methods to avoid false signals.
References:
Fosback, N. G. (n.d.). A Classic The Zweig Forecast SOPHISTICATED APPROACH TO PROFITS ON WALL STREET.
Explore our Algorithmic Trading Courses: