Introduction to the On-Balance Volume (OBV) Indicator:
On-Balance Volume (OBV) is a technical indicator based on volume. It adds volume when the current close is higher than the previous close and subtracts volume when the current close is lower than the previous close. In other words, it represents the cumulative sum of the red and green volume bars (where red bars are considered negative, and green bars are considered positive). Often, it is smoothed by a moving average (SMA or EMA). This cumulative volume-based indicator was developed by Joseph Granville in the 1960s and is detailed in the book ‘Granville’s New Key to Stock Market Profits.
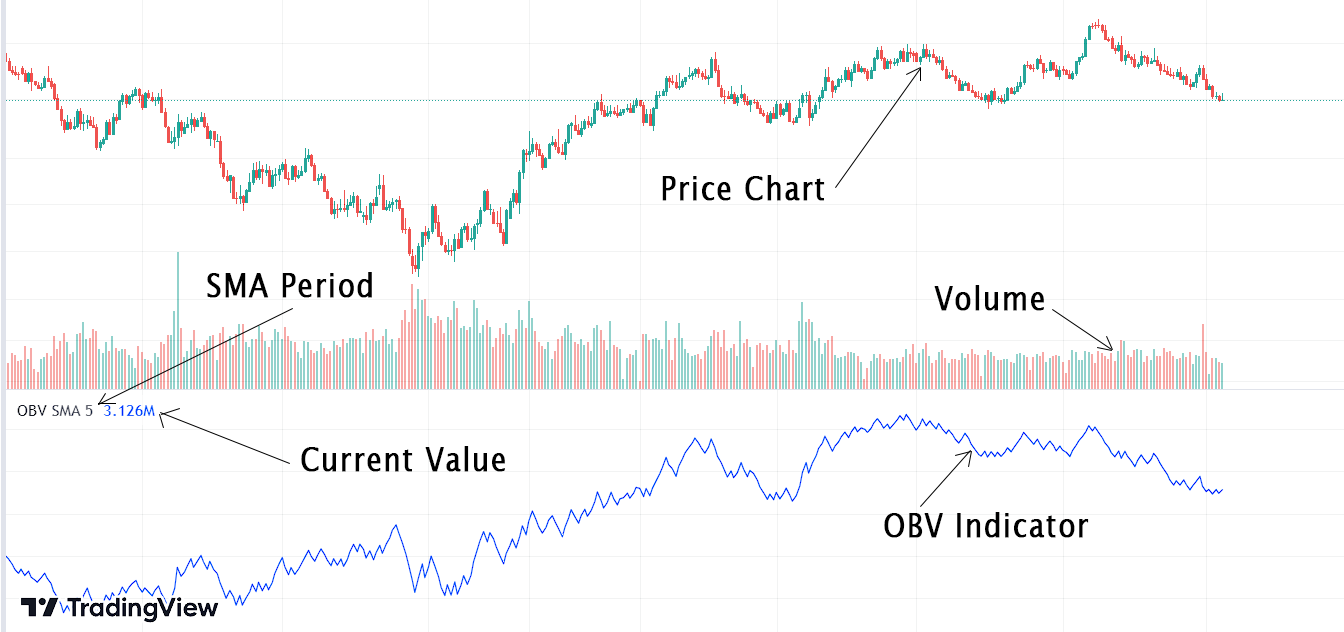
Now, let’s take a look at what this indicator looks like in TradingView.
Calculation of the On-Balance Volume – The formula:
OBV is calculated using following formula –
OBV = Previous OBV + Current Volume, if the Close > Previous Close
OBV = Previous OBV – Current Volume, if the Close < Previous Close
OBV = Previous OBV (no change), if the Close = Previous Close
Here, “Previous OBV” represents the OBV value of the previous period, “Current Volume” is the trading volume of the current period, and “Close” refers to the closing price of the current period.
Now, let us see an example of how this indicator is calculated.
Suppose we have the following daily price and volume data for a stock:
- Day 1: Close = $50, Volume = 100, OBV (initial value) = 0
- Day 2: Close = $55, Volume = 120
- Day 3: Close = $48, Volume = 90
- Day 4: Close = $60, Volume = 150
Now, let’s calculate the OBV for each day:
- Day 2: OBV = Previous OBV (0) + Current Volume (120) = 0 + 120 = 120
- Day 3: OBV = Previous OBV (120) – Current Volume (90) = 120 – 90 = 30
- Day 4: OBV = Previous OBV (30) + Current Volume (150) = 30 + 150 = 180
So, the OBV values for each day are as follows: Day 1 (0), Day 2 (120), Day 3 (30), and Day 4 (180). The OBV indicator accumulates volume based on whether the current closing price is greater or smaller than the previous day, providing traders with a visual representation of the balance between buying and selling pressure in a stock or asset.
Interpreting the On-Balance Volume:
When interpreting the On-Balance Volume (OBV), we consider the trend of the indicator rather than its absolute value.
- If the On-Balance Volume is in an uptrend, it indicates that the volume associated with green-colored or bullish candles is higher than the volume associated with red-colored or bearish candles during that period.
- If the On-Balance Volume is in a downtrend, it indicates that the volume associated with red-colored or bearish candles is higher than the volume associated with green-colored or bullish candles during that period.

Trading strategies with the On-Balance Volume:
Trend Confirmation –
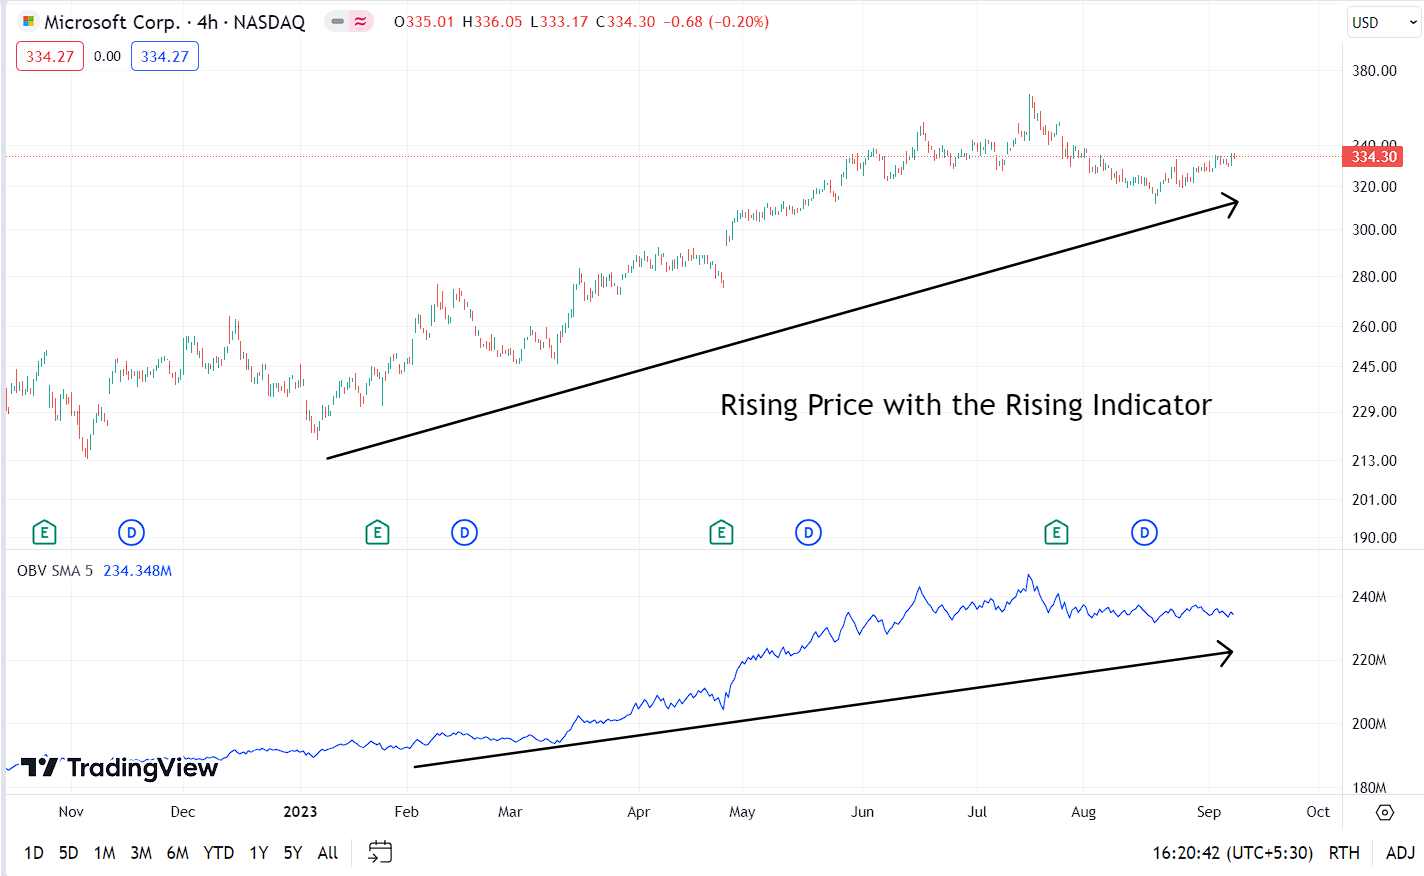
- If an uptrend in the price chart is associated with a strong uptrend in On-Balance Volume, it means the bullish trend is associated with positive cumulative volume, and the uptrend is most likely to continue.
- If a downtrend in the price chart is accompanied by a strong downtrend in On-Balance Volume, it indicates that the bearish trend is associated with negative cumulative volume, and the downtrend is likely to persist.
In the following two examples, you can observe a strong uptrend and a strong downtrend, respectively. In both situations, the OBV indicator is closely corresponding with the price chart.

Spotting the Smart Money –
Smart money refers to large institutional traders and banks. Often, they buy an asset when other retail traders are selling the asset. This results in a large trading volume while the price is consolidating. Eventually, the price will increase. After a significant rise in price, smart money will sell the asset while retail traders are buying the asset.
This is the reason why most retail traders lose money in trading. They buy an asset after the price has risen to a certain level but not at the beginning. At this point, smart money will sell the asset, causing the price to fall.
- If the market is ranging while the On-Balance Volume is rising, it suggests accumulation is taking place, and an uptrend is likely to occur in the near future.
- If the market is ranging while the On-Balance Volume is falling, it suggests distribution is taking place, and a downtrend is likely to occur in the near future.
In the following example, you can observe that the market is ranging while the indicator is in an uptrend. This suggests that volume is accumulating, and there is likely to be an uptrend in the near future.

Spotting the Divergence –
When spotting divergence, it is based on the theory that volume precedes the price.
- Bullish Divergence – If the price chart is forming lower lows while the OBV is making higher lows, this indicates a bullish divergence. It suggests that the downtrend is losing momentum, and there is a higher probability of a bullish reversal in the near future.
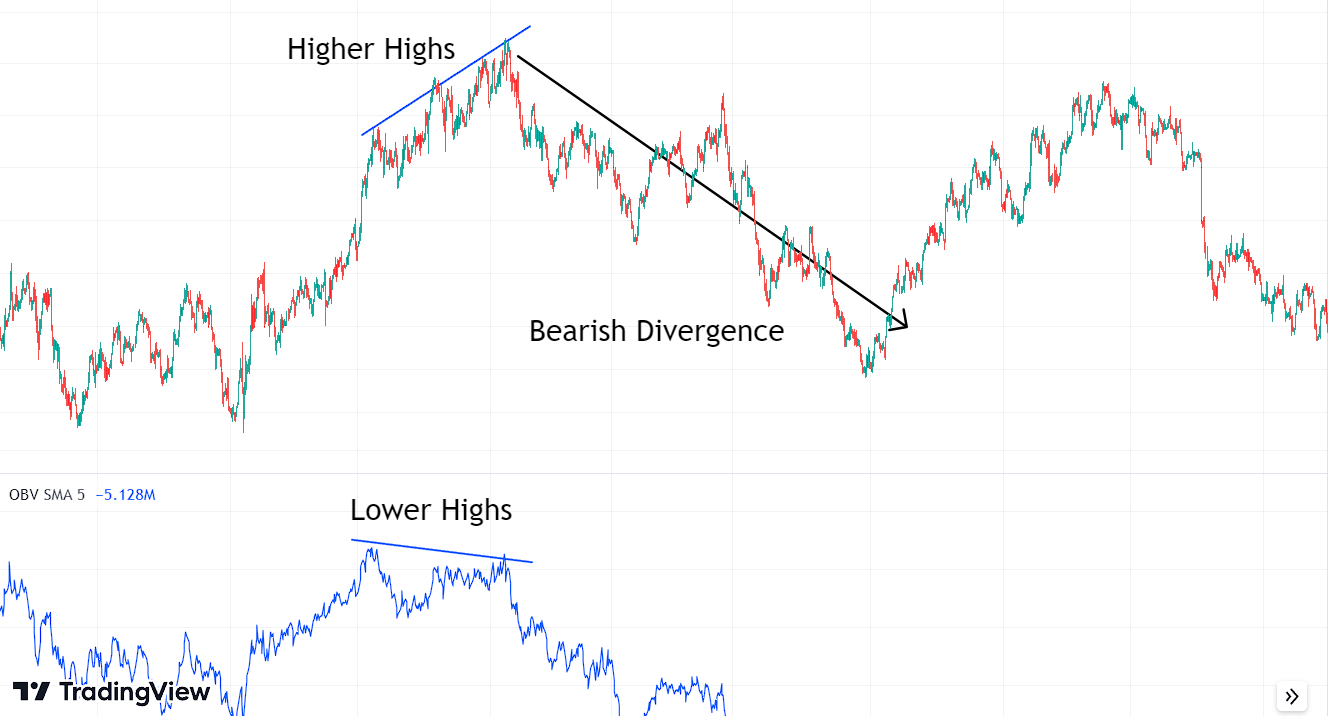
- Bearish Divergence – If the price chart is forming higher highs while the OBV is making lower highs, this indicates a bearish divergence. It suggests that the uptrend is losing strength, and there is a higher probability of a bearish reversal in the near future.

Using On-Balance Volume Indicator with the Trading View:
Goto Indicators , then search for ” On Balance Volume”. Then click on the name of indicator to insert it into the chart.

Using On-Balance Volume Indicator with the Mt5:
Go to Insert > Indicators > Volumes > On-Balance Volume, then click on the name of the indicator to insert it into the chart.

Conclusion:
The On-Balance Volume indicator is based on the assumption that volume precedes the price. Since it is a leading indicator, it can be used to make market predictions, especially in cases of divergence, accumulation, or distribution when the price is ranging. However, it is important to keep in mind that it can produce false signals. To mitigate the impact of these false signals, it is essential to use the On-Balance Volume indicator in conjunction with other indicators and trading methods, such as support/resistance breakout, trendline breakout, and confirmation through overbought/oversold conditions, among others.
References:
Granville, J. E. (Joseph E. (1976). Granville’s new strategy of daily stock market timing for maximum profit. 350.
On-balance volume – Wikipedia. (n.d.). Retrieved September 10, 2023, from https://en.wikipedia.org/wiki/On-balance_volume
Explore our Algorithmic Trading Courses: