Introduction to The Percentage Price Oscillator (PPO):
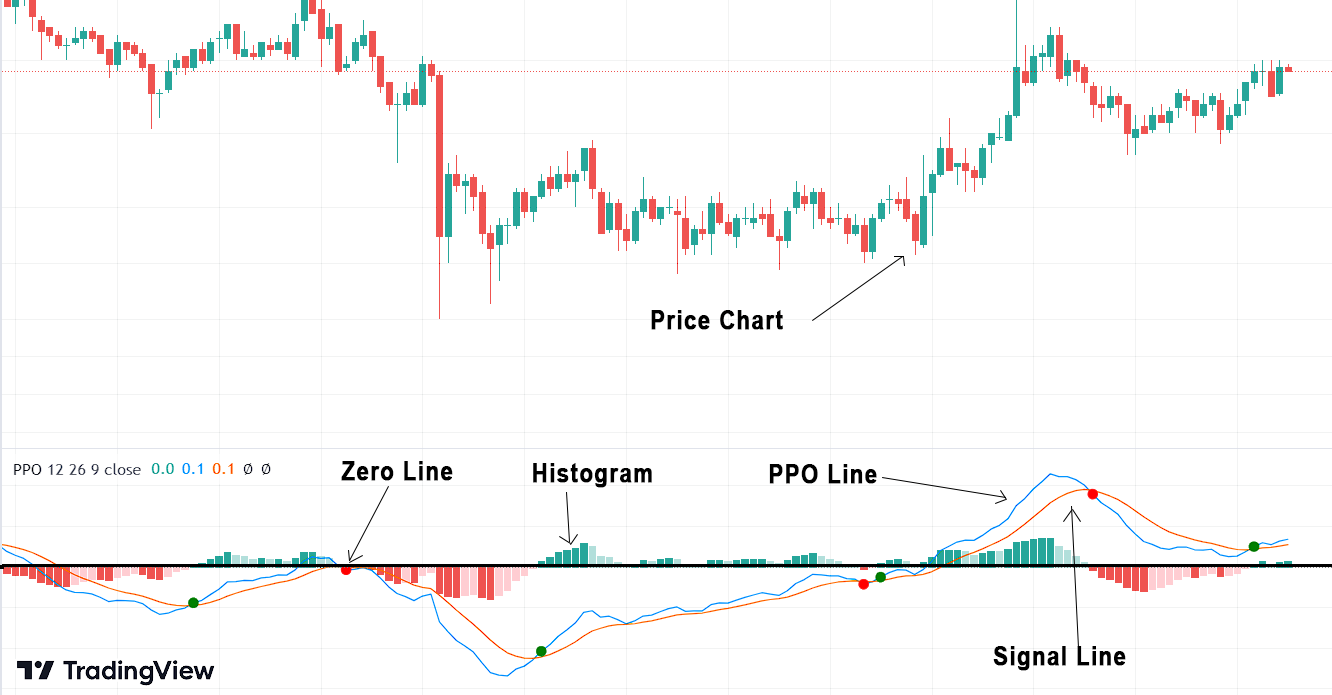
Similar to MACD (Moving Average Convergence Divergence), the Percentage Price Oscillator (PPO) is a momentum oscillator. This indicator comprises three main components:
- PPO line
- Signal line
- Histogram
Understanding the Percentage Price Oscillator (PPO): The Formula:
- PPO Line – PPO is derived from the 26-day exponential moving average (EMA) and the 12-day EMA. The formula to calculate the PPO is as follows: PPO = [(12-period EMA – 26-period EMA) / 26-period EMA] * 100
- Signal Line – The Signal line represents the 9-period Exponential Moving Average (EMA) of the PPO line. As it is derived from the moving average of the PPO, it tends to be smoother and reacts more slowly to price changes compared to the PPO line. Signal line = EMA (PPO,9)
- Histogram – This represents the difference between the PPO line and the Signal line. Histogram = PPO line – Signal line
Generating Signals with Percentage Price Oscillator (PPO):
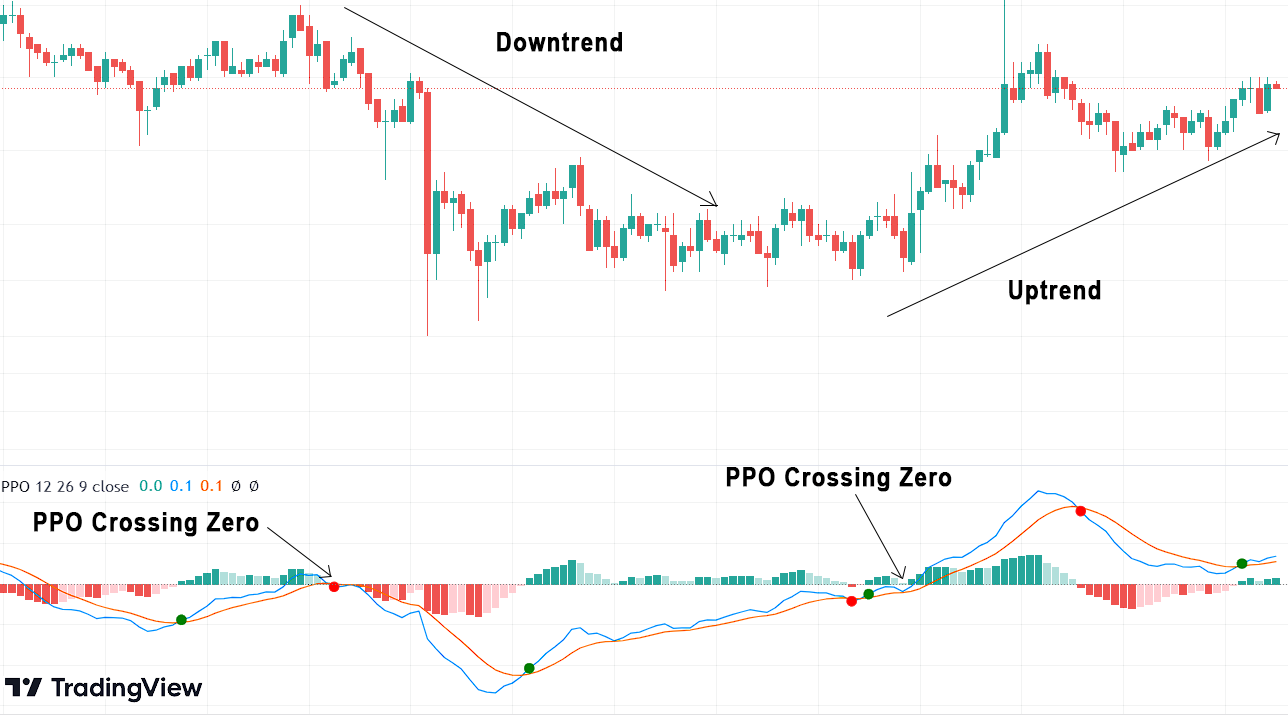
The Percentage Price Oscillator oscillates around a central zero line. A positive value suggests that in relation to the long-term moving average, the short-term moving average is higher, indicating bullish momentum. Conversely, a negative value indicates that in relation to the long-term moving average, the short-term moving average is lower, signaling bearish momentum.
Traders often look for the following signals when analyzing the PPO:
- Bullish Signal: When the PPO crosses above the zero line, it generates a bullish signal, indicating a potential uptrend and suggesting a buying opportunity.
- Bearish Signal: On the other hand, when the PPO crosses below the zero line, it generates a bearish signal, suggesting a potential downtrend and a signal to consider selling or shorting positions.
- Signal Line Crossovers: The PPO also has a signal line, usually a 9-day EMA, which can generate additional trading signals. When the PPO crosses above its signal line, it generates a bullish crossover. Conversely, when it crosses below the signal line, it produces a bearish crossover.
Using PPO with Divergence Analysis:
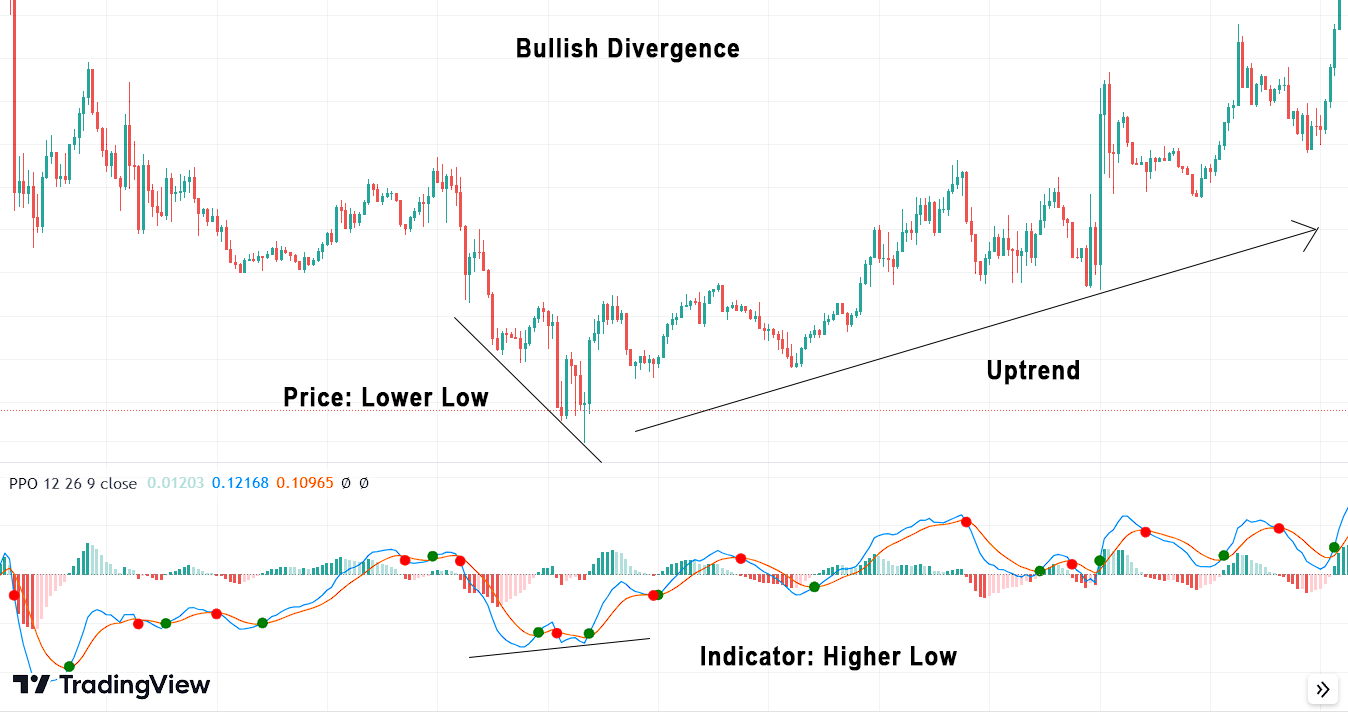
Beyond the traditional signals mentioned above, traders can apply divergence analysis to enhance the effectiveness of the PPO. Divergence occurs when the PPO shows a different trend compared to the price action of the security.
- Bullish Divergence: This will occur when the price of the security forms a lower low while the PPO forms a higher low. This suggests that the downward momentum is weakening, potentially indicating an upcoming bullish reversal.
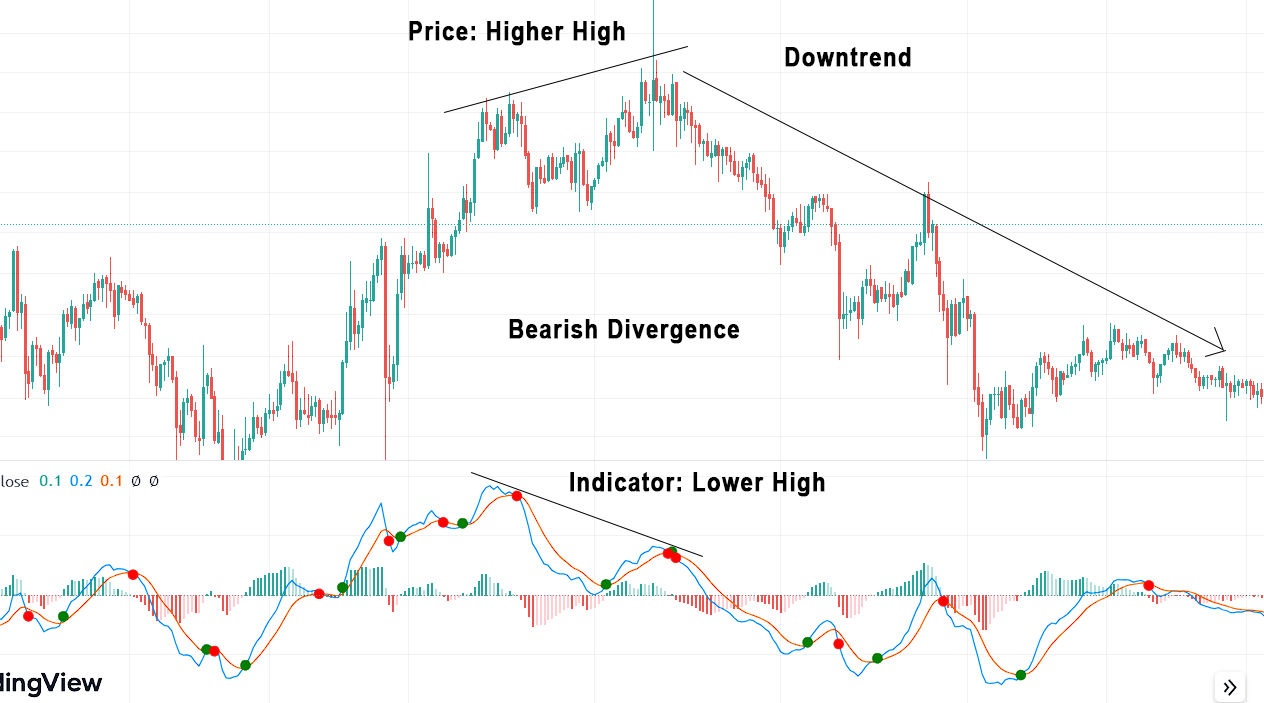
- Bearish Divergence: On the other hand, a bearish divergence takes place when the price of the security forms a higher high while the PPO forms a lower high. This implies that the upward momentum is waning, possibly signaling a bearish reversal.
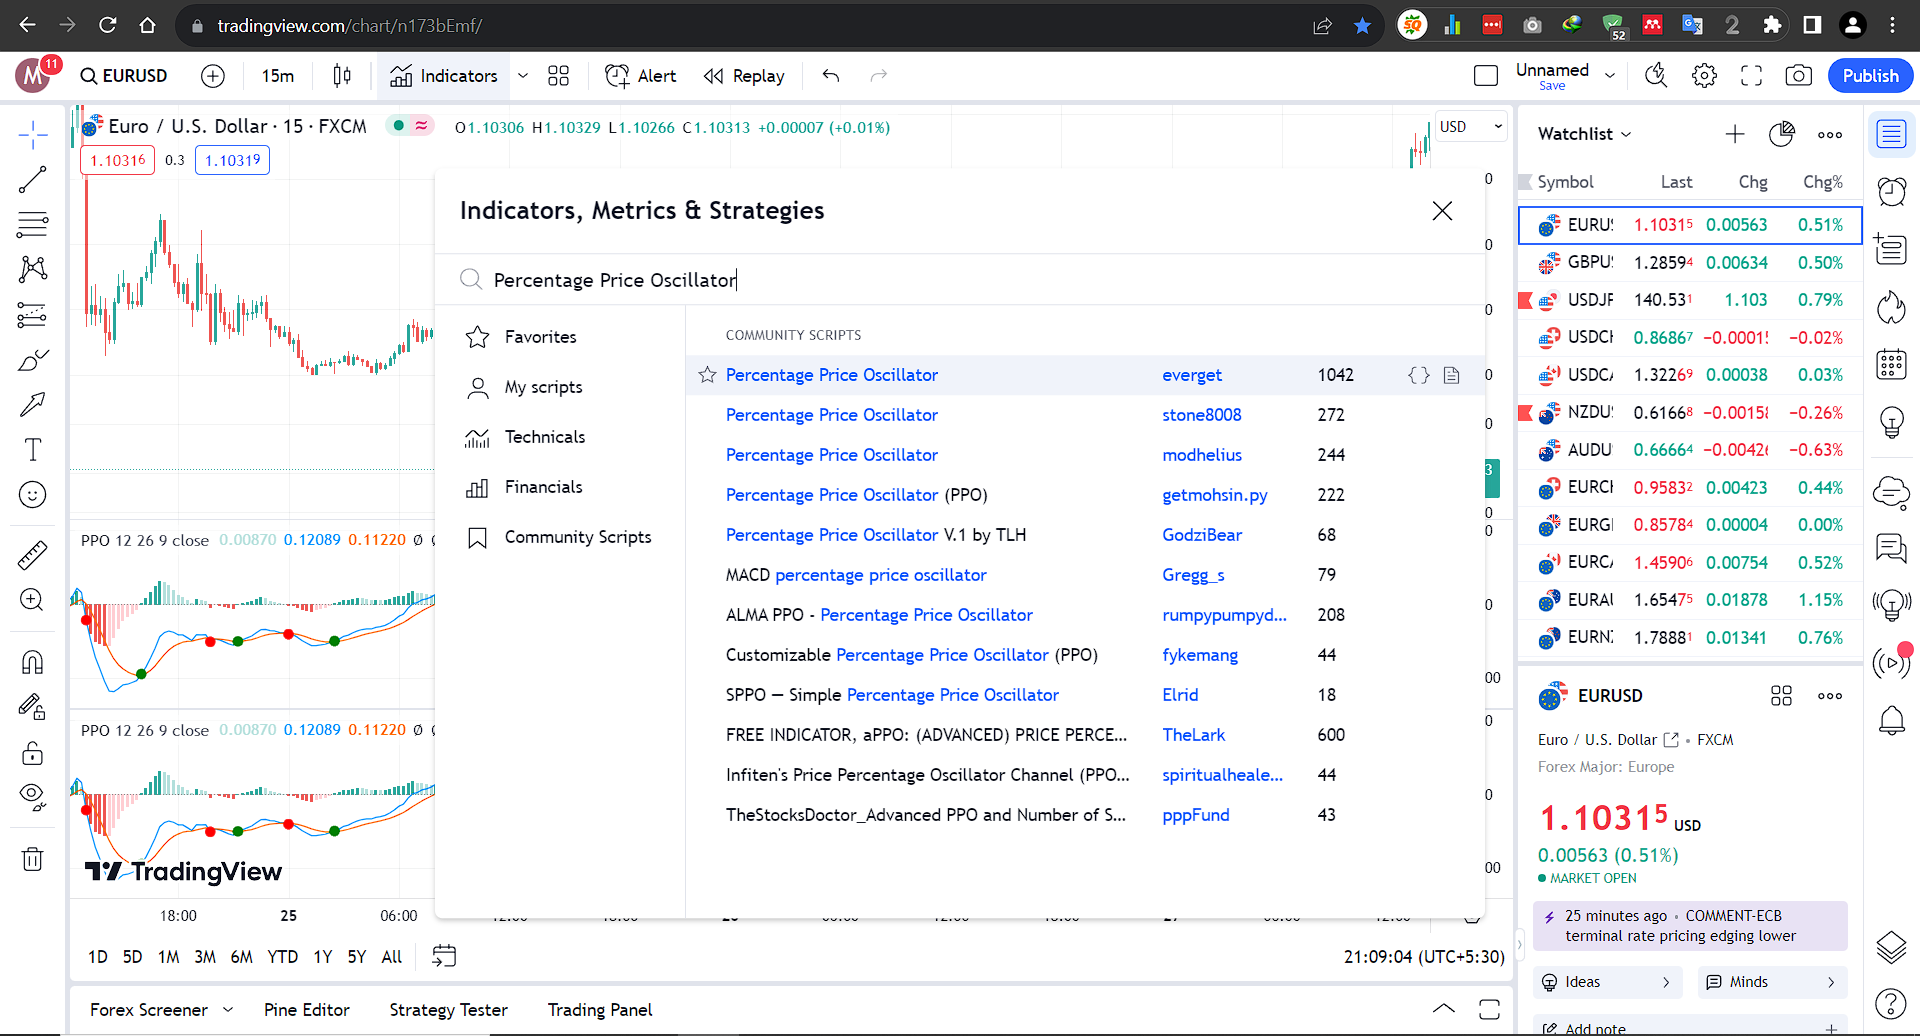
Using Percentage Price Oscillator (PPO) with Tradingview:
Goto Indicators, then search for “‘Percentage Price Oscillator.” Click on the name of indicator to insert it into chart
Risk Management and Limitations
Like any technical indicator, the Percentage Price Oscillator is not foolproof and has certain limitations. It may generate false signals during periods of choppy or sideways markets. Therefore, to confirm signals accurately, it is essential to combine the PPO with other indicators or technical tools.
Conclusion
The Percentage Price Oscillator (PPO) is a valuable tool for traders and investors seeking to gauge a security’s momentum and potential trend reversals. By analyzing the relationship between short-term and long-term moving averages, the PPO offers valuable insights into market sentiment. When used in combination with other technical analysis methods and risk management strategies, the PPO can be a powerful tool to inform trading decisions and improve overall trading performance. As with any technical indicator, it is essential to practice due diligence and continually refine one’s trading strategies for consistent success in the financial markets.
Explore Our Algorithmic Trading Courses: