Introduction to the Stochastic Oscillator:
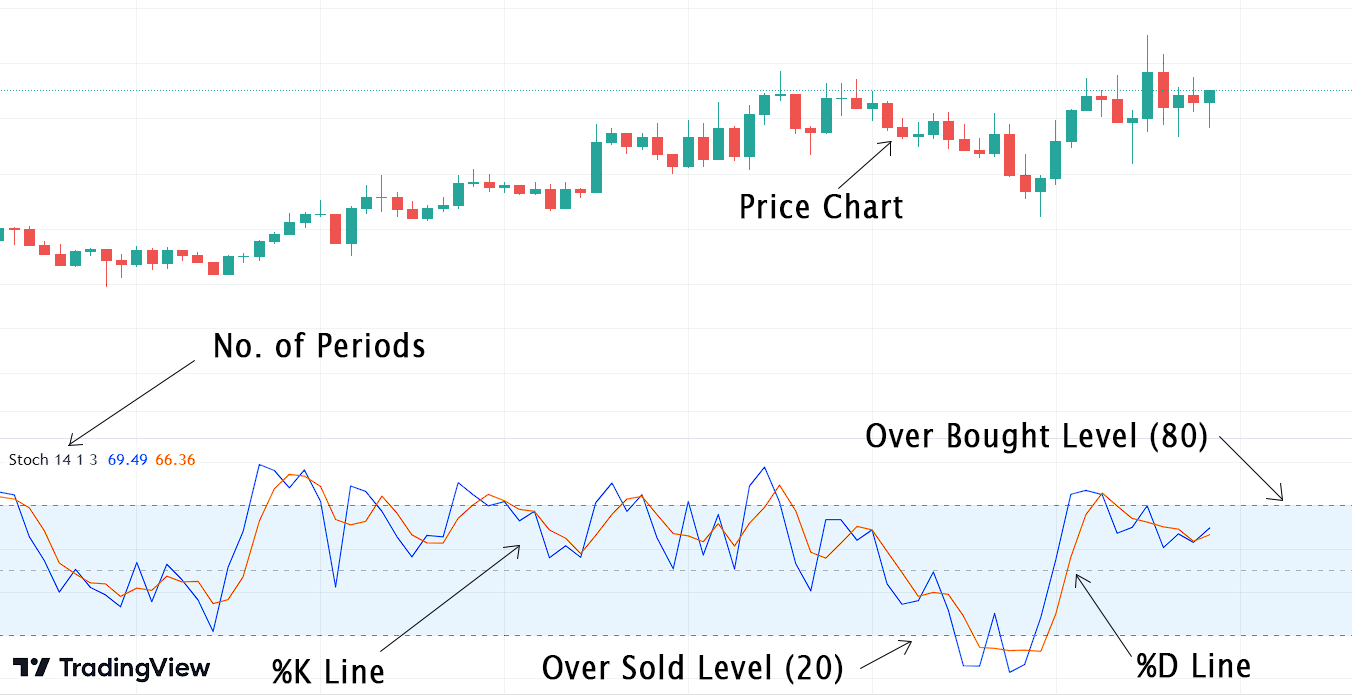
The Stochastic Oscillator, developed by George C. Lane in the 1950s, is an indicator designed to measure momentum. It comprises two lines that fluctuate between 0 and 100, referred to as %K and %D. The %D line is smoother and represents an average of %K over 3 periods. When the %K value goes above 80, it suggests the market might be overbought. On the other hand, if it goes below 20, it indicates the market could be oversold.
Calculating the Stochastic Oscillator – The Formula:
The formula for calculating the Stochastic Oscillator is as follows:
- Calculate %K: %K = ((Closing Price – Lowest Low) / (Highest High – Lowest Low)) * 100
- Smooth %K to Calculate %D: %D = Simple Moving Average of the last 3 %K values
Where:
- Closing Price: The current closing price of the asset.
- Lowest Low: The lowest price observed over a specific period.
- Highest High: The highest price observed over the same specific period.
- %K: The calculated value representing the current position of the closing price relative to the price range.
- %D: The smoothed %K value, often referred to as the signal line. It provides a more refined view of the indicator’s movement over time.
Suppose we’re examining a currency pair’s price trends over a 14-day period. Let’s break down the steps to compute the Stochastic Oscillator:
- Gather Data: Collect the daily closing prices of the currency pair for the past 14 days.Day 1: $1.25 Day 2: $1.28 Day 3: $1.24 … Day 14: $1.30
- Determine the Range: Identify the highest high (H) and lowest low (L) within the 14-day span.Highest High (H): $1.30 Lowest Low (L): $1.24
- Calculate %K: Utilize the formula to compute the %K value:%K = ((Closing Price – Lowest Low) / (Highest High – Lowest Low)) * 100
For Day 14: %K = (($1.30 – $1.24) / ($1.30 – $1.24)) * 100 = 71.43
- Smooth %K to Calculate %D: Calculate the 3-day simple moving average of %K. Assuming %K values for the last three days were: Day 14: 71.43, Day 13: 60.00, Day 12: 55.56%D = (71.43 + 60.00 + 55.56) / 3 = 62.33
Interpreting the Stochastic Oscillator:
Traders use the Stochastic Oscillator to identify potential market turning points. When the %K line crosses above the %D line and moves above a certain threshold (e.g., 80), it suggests the asset might be overbought, indicating a potential price reversal or correction. Conversely, when the %K line crosses below the %D line and dips below a specific level (e.g., 20), it indicates potential oversold conditions, signaling a potential upward price movement.

Spotting Divergence with the Stochastic Oscillator:
Divergence occurs when there is a discrepancy between the price movement of an asset and the movement of the Stochastic Oscillator. This phenomenon can signal potential reversals in market direction, offering traders opportunities to make informed decisions.
There are four primary types of divergence that traders commonly watch for:
- Regular Bullish Divergence: This occurs when the price of an asset forms lower lows while the Stochastic Oscillator generates higher lows. It suggests that momentum might be building for a bullish reversal, even though the price continues to decrease.

- Regular Bearish Divergence: In contrast, regular bearish divergence emerges when the price forms higher highs while the Stochastic Oscillator creates lower highs. This can indicate that despite the rising price, momentum might be waning, potentially heralding a bearish reversal.

- Hidden Bullish Divergence: Bullish hidden divergence occurs when the price chart of an asset forms a higher low, while the oscillator forms a lower low. This indicates that even though the price is showing a temporary pullback or correction in an ongoing uptrend,the uptrend is likely to continue after the pullback.

- Hidden Bearish Divergence: Bearish hidden divergence occurs when the price chart of an asset forms a lower high, but the oscillator forms a higher high. This indicates that despite the price showing a temporary bounce or correction in an ongoing downtrend, the downtrend is likely to continue after the bounce.

Stochastic Oscillator vs RSI Indicator:
Both tools aim to gauge market momentum and identify potential overbought and oversold conditions, yet they do so in distinctive ways.
Relative Strength Index (RSI):
The RSI is a momentum oscillator that measures the speed and change of price movements. It typically ranges from 0 to 100, with readings above 70 indicating overbought conditions and readings below 30 suggesting oversold conditions. The RSI considers the magnitude of price changes, making it sensitive to recent price swings. It’s particularly valuable for identifying trend reversals and assessing the underlying strength of a price trend.
Stochastic Oscillator:
The Stochastic Oscillator, on the other hand, also measures momentum, but it does so by comparing the closing price of an asset to its price range over a specified period. It consists of two lines, %K and %D, fluctuating between 0 and 100. While values above 80 and below 20 indicate overbought and oversold conditions respectively.
Overall, the RSI is more useful in trending markets, while the Stochastic Oscillator is more suitable for ranging markets.
Using Stochastic Oscillator with Tradingview:
Goto Indicators, then search for “Stochastic .” Click on the name of indicator to insert it into chart

Using Stochastic Oscillator with MetaTrader 5 (MT5):
Open Meta Trader. Then Insert > Indicators > Oscillators > Stochastic Oscillator

Conclusion:
In conclusion, the Stochastic Oscillator is a valuable indicator for measuring market momentum and spotting potential overbought and oversold levels. However, it’s important to recognize that it can generate false signals more frequently, particularly during periods of heightened market volatility. To minimize the impact of these misleading signals, traders should give importance to combining the Stochastic Oscillator with other technical indicators and analysis techniques. This helps provide a clearer picture and make better decisions in trading.
Explore Our Algorithmic Trading Courses: