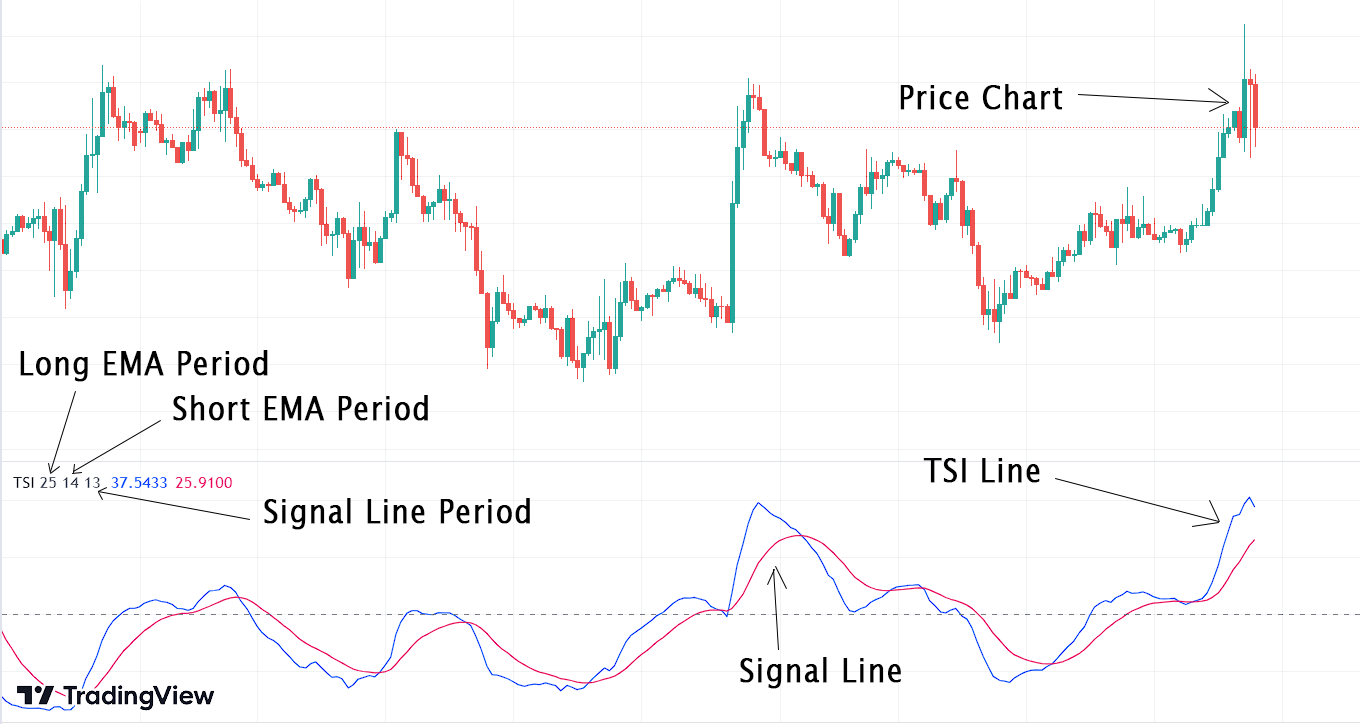
Introduction to the TSI Indicator:
The True Strength Index (TSI) Indicator, developed by William Blau in 1991, represents a unique hybrid of a momentum oscillator and a moving average. Unlike traditional momentum indicators, the TSI employs a dual calculation process involving short-term and long-term Exponential Moving Averages (EMAs). This approach filters out market noise, offering traders a clearer view of trend direction and potential overbought or oversold conditions. The TSI’s components include TSI Line and a Signal Line.
Calculation of the TSI Indicator – The Formula:
Calculation of the TSI Indicator is a multi step process
Part 1: Price Change Calculation
The calculation of the TSI Indicator begins by computing the price change between consecutive periods. This is achieved by subtracting the closing price of the previous period from the closing price of the current period. The resulting value illustrates the price change over the specified time frame.
Part 2: 25-period EMA of Price Change
Building on the price changes, the TSI journey progresses to the calculation of a 25-period Exponential Moving Average (EMA) of these price changes. This step assists in smoothing out short-term fluctuations and accentuating the underlying price trends, creating a clearer picture of the momentum direction.
Part 3: Double Smoothing with 13-period EMA
With the 25-period EMA in hand, the TSI calculation introduces a double smoothing technique. A 14-period EMA is then calculated based on the 25-period EMA values. This double smoothing enhances the TSI’s ability to filter noise and highlight more meaningful trends, ultimately refining its reliability.
Part 4: Absolute Price Change and Double Smoothing
Simultaneously, the TSI calculation addresses the concept of absolute price changes. Instead of considering just the price changes, the absolute values of these changes are computed. Following this, a 25-period EMA of the absolute price changes is calculated, closely mirroring the process applied to the regular price changes. 14-period EMA is then calculated based on the 25-period EMA values.
Part 5: Final TSI Formula
TSI = (Double Smoothed Price Change / Absolute Double Smoothed Price Change) * 100
Calculating the Signal Line
To enhance the TSI’s reliability, a Signal Line is applied, which is typically a smoothed version of the TSI itself. The calculation involves applying an EMA to the TSI values over a specific period (default: 13 periods) to create the Signal Line:
Signal Line = EMA of TSI over 13 periods
Interpreting the TSI Indicator:
The TSI Indicator consists of two main components:
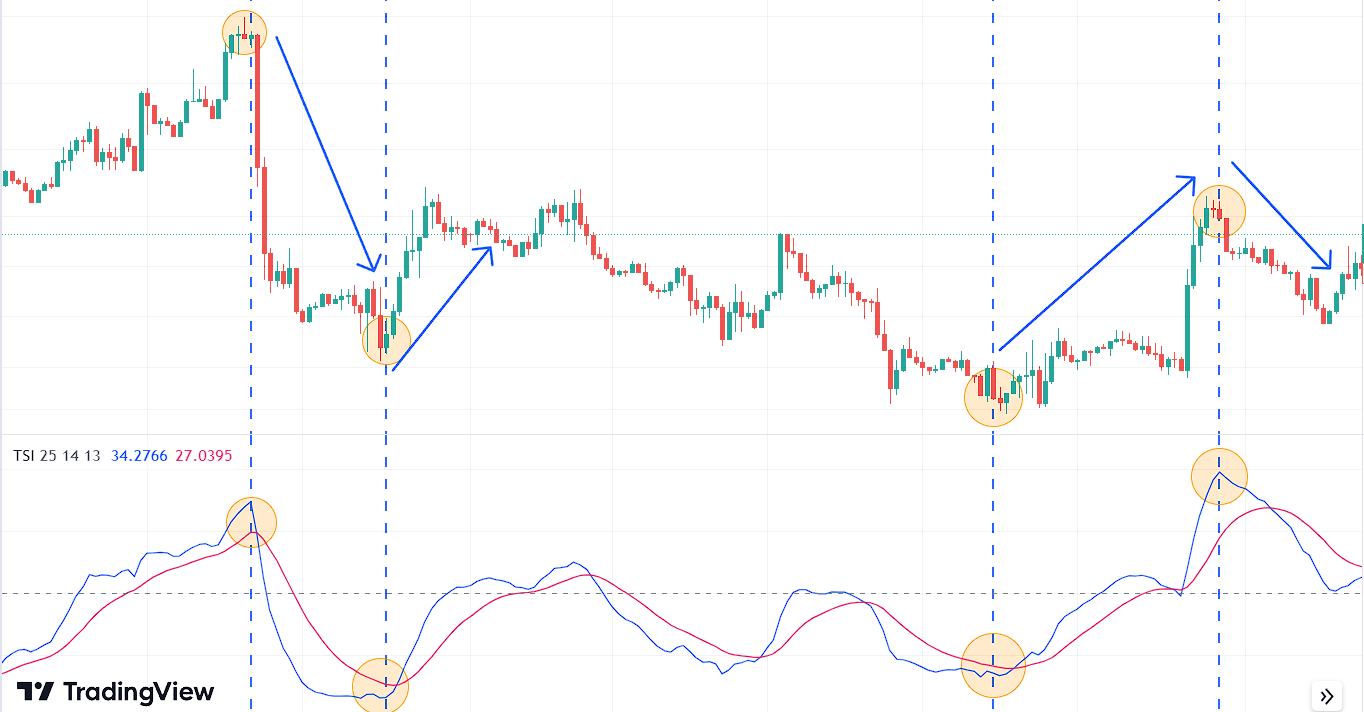
- Signal Line: This component represents a smoothed version of the TSI itself, aiming to provide traders with clearer signals by removing fluctuations. Crossovers between the TSI and its Signal Line can be considered as potential buying or selling signals.
- Overbought and Oversold Conditions: TSI values above a certain threshold (e.g., +25) can indicate overbought conditions, implying a potential reversal or correction. Conversely, TSI values below another threshold (e.g., -25) can signal oversold conditions, hinting at a potential upward reversal. Remember that the overbought/oversold threshold depends on the price of the asset. (For some assets, it can be 50/-50, and for others, it can be 20/-20.)
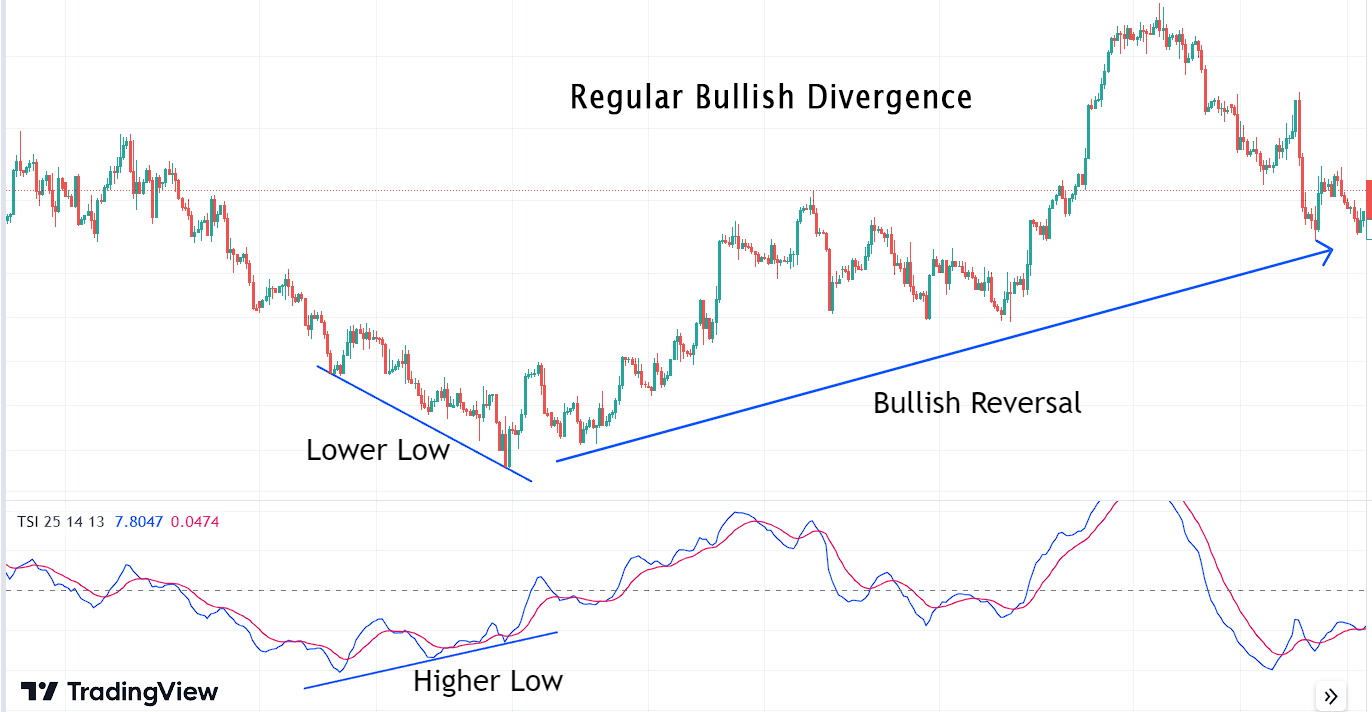
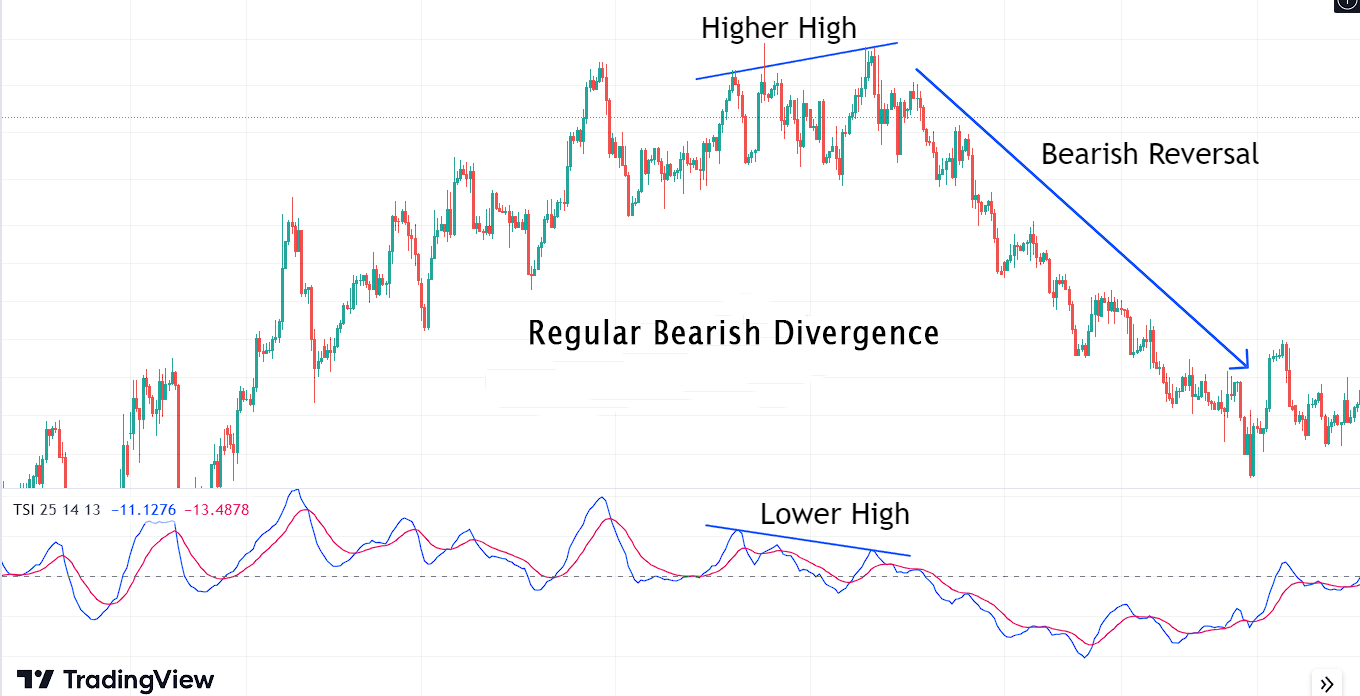
Spotting Divergence with the TSI Indicator:
Divergence occurs when there is a discrepancy between the price movement of an asset and the movement of the TSI Indicator. This phenomenon can signal potential reversals in market direction, offering traders opportunities to make informed decisions.
There are four primary types of divergence that traders commonly watch for:
- Regular Bullish Divergence: This occurs when the price of an asset forms lower lows while the TSI Indicator generates higher lows. It suggests that momentum might be building for a bullish reversal, even though the price continues to decrease.
- Regular Bearish Divergence: In contrast, regular bearish divergence emerges when the price forms higher highs while the TSI Indicator creates lower highs. This can indicate that despite the rising price, momentum might be waning, potentially heralding a bearish reversal.
- Hidden Bullish Divergence: Hidden bullish divergence occurs when the price forms higher lows while the TSI Indicator generates lower lows. This type is often observed during a minor pullback within an overall uptrend, suggesting the potential continuation of the bullish trend.
- Hidden Bearish Divergence: Hidden bearish divergence appears when the price forms lower highs while the TSI Indicator generates higher highs. This can suggest that even though there is a temporary price rise, momentum might be decreasing, hinting at a potential bearish continuation.
Using Stochastic Oscillator with Tradingview:
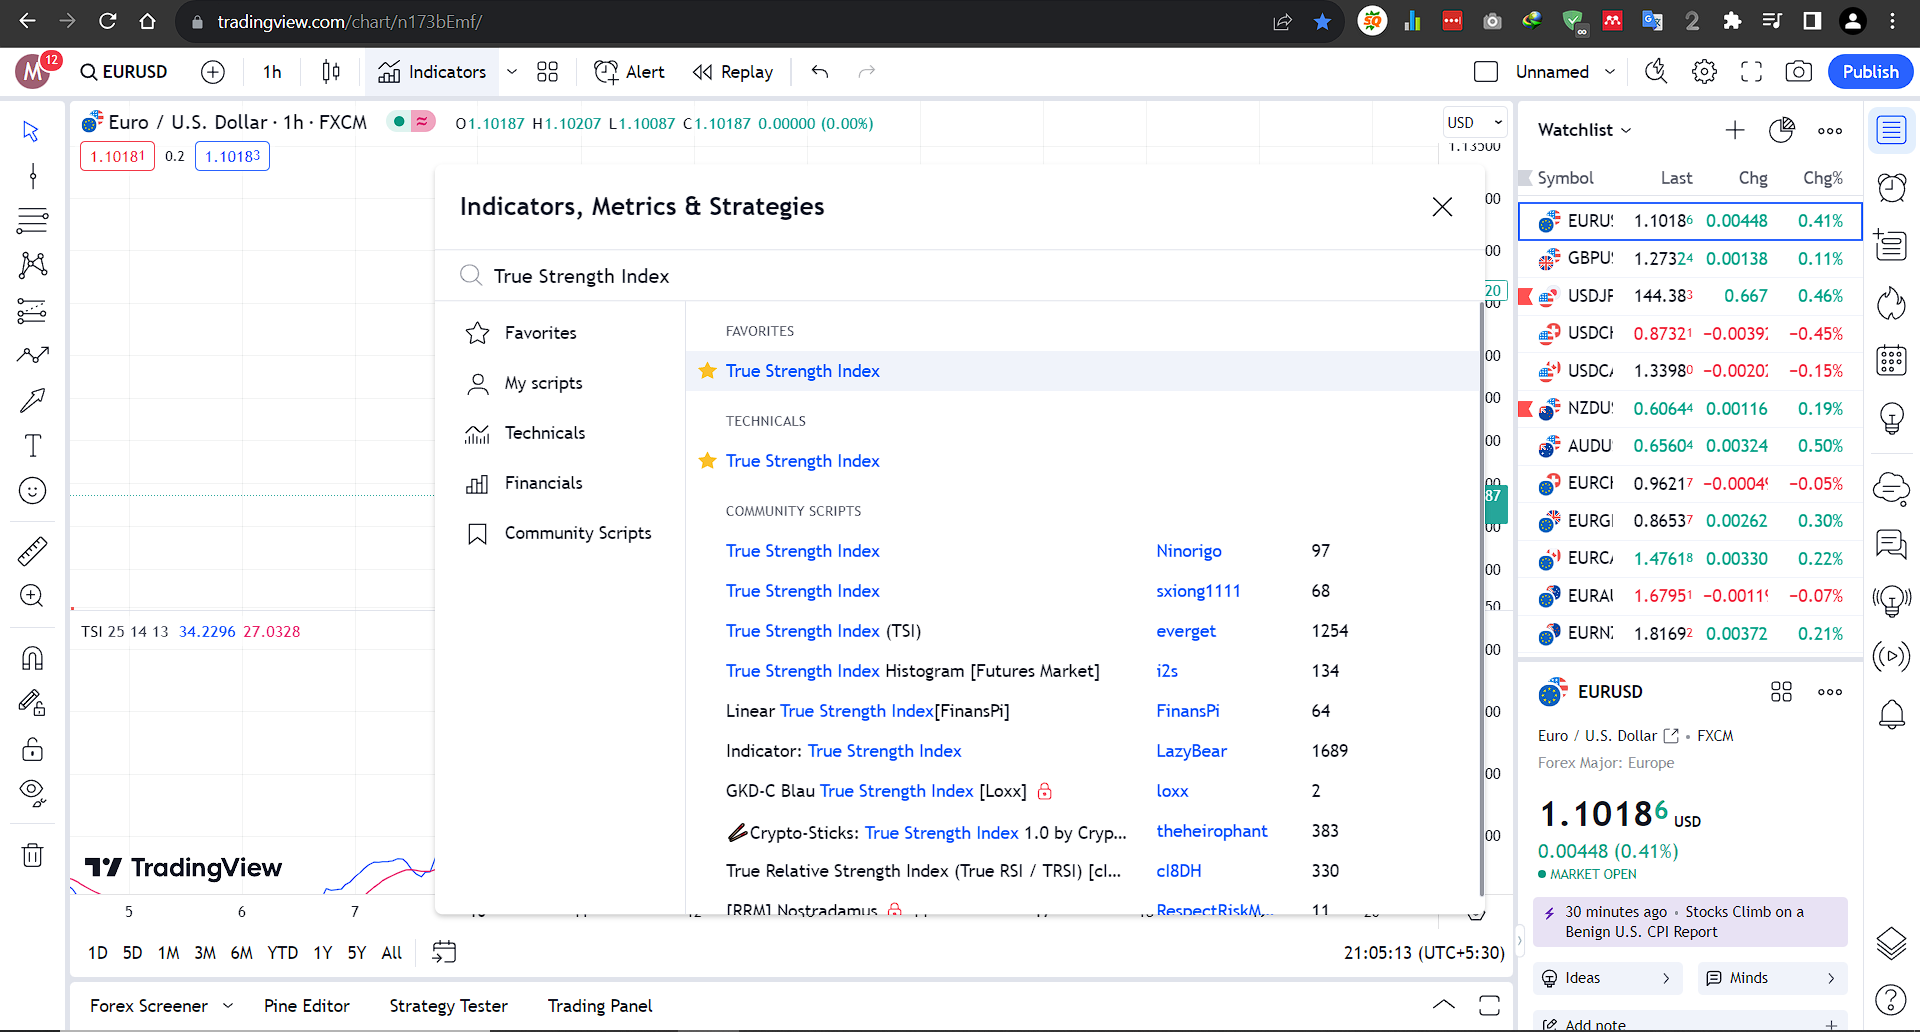
Goto Indicators, then search for ” True Strength Index.” Click on the name of indicator to insert it into chart
Conclusion:
In conclusion, the True Strength Index / TSI Indicator is a valuble tool for traders. By understanding its calculation, interpretation, and integration into strategies, you can identify trends, reversals, and entry/exit points effectively. Remember, TSI should be used with market analysis and risk management for a comprehensive trading approach.
Explore Our Algorithmic Trading Courses: