Introduction to the Ultimate Oscillator:
The Ultimate Oscillator, introduced by Larry Williams in the 1970s, measures momentum across three timeframes. By integrating data from short, intermediate, and long-term timeframes, this multi-dimensional indicator produces a single line that oscillates between 0 and 100. Readings above 70 signal potential overbought conditions, while readings below 30 suggest potential oversold conditions. The Ultimate Oscillator can be used to identify divergence between price and momentum, confirm trends, and determine potential buying or selling opportunities based on the overbought or oversold levels.

Calculation of the Ultimate Oscillator – The Formula:
Calculating the Ultimate Oscillator involves a series of steps to determine the strength or weakness of a market’s momentum. Here’s a breakdown of the process, including the formulas for each step:
- Find Buying Pressure (BP): For each period, calculate the buying pressure, which indicates how much upward pressure is causing the price to rise. To do this, subtract the lowest value between the low of the period and the previous day’s closing price from the current day’s closing price.BP=Close−min(Low,Prior Close)
- Determine True Range (TR): Calculate the true range, which measures the full price movement during a period. Find the highest value between the high of the period and the previous day’s closing price, and subtract the lowest value between the low of the period and the previous day’s closing price.TR=max(High,Prior Close)−min(Low,Prior Close)
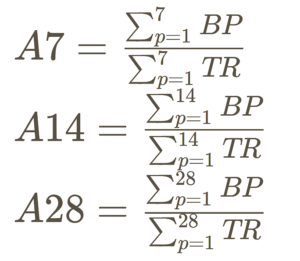
- Calculate Averages: Add up the buying pressure (BP) and true range (TR) values for the last seven, 14, and 28 periods. Then, divide the sum of buying pressures by the sum of true ranges for each timeframe to get three averages: A7, A14, and A28.
- Use the Formula: Plug the calculated averages (A7, A14, A28) into the Ultimate Oscillator formula:
UO= [(A7×4+ A14×2+ A28×1)/ (4+2+1)] × 100
This formula combines the weighted averages of buying pressure to provide a single number that indicates the strength or weakness of the market’s momentum.
Interpreting the Ultimate Oscillator:
A reading below 30 is generally considered oversold, indicating a potential buying opportunity, while a reading above 70 is often seen as overbought, suggesting a possible selling opportunity. Traders can also look for bullish and bearish divergences between the oscillator and price movement, which can signal potential trend reversals.

Spotting Divergence with the Ultimate Oscillator:
Divergence occurs when there is a discrepancy between the price movement of an asset and the movement of the Oscillator. This phenomenon can signal potential reversals in market direction.
There are four primary types of divergence that traders commonly watch for:
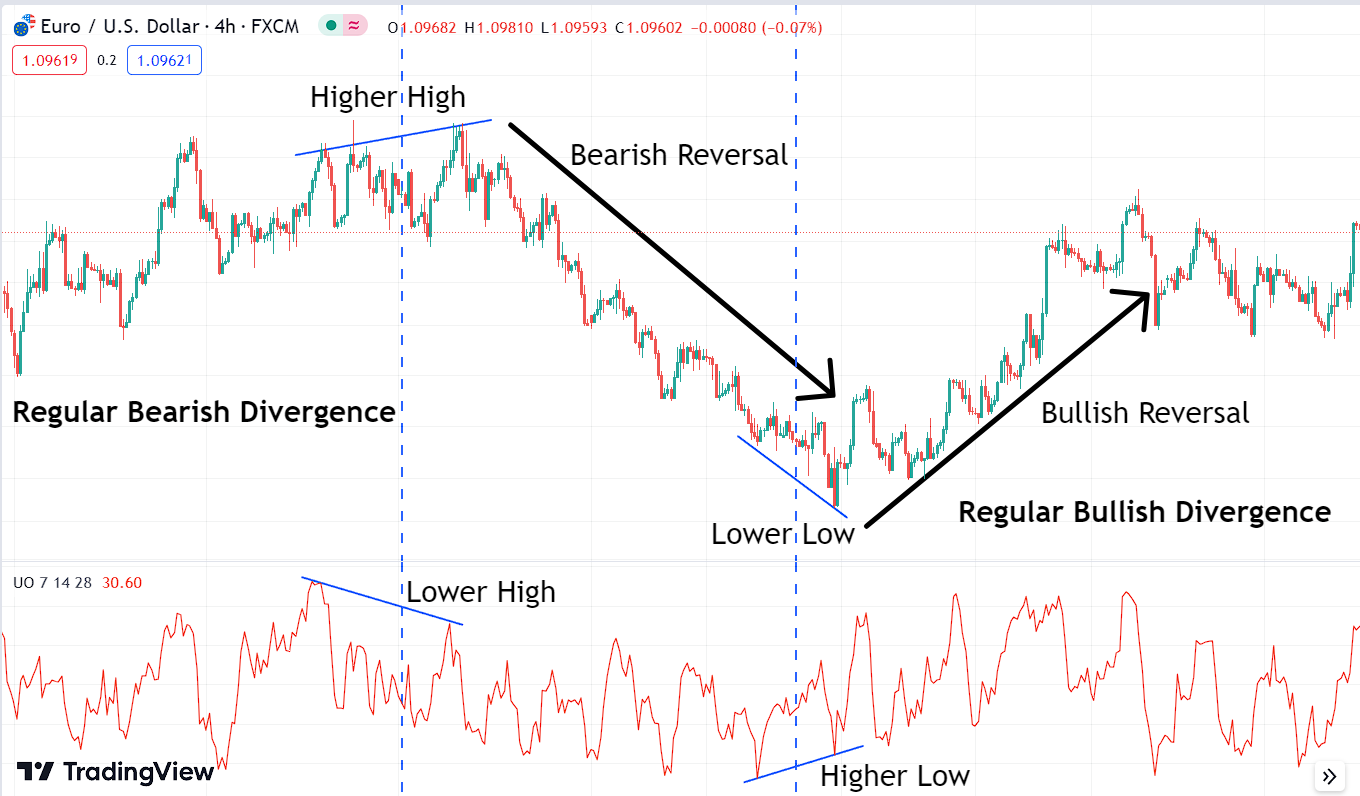
- Regular Bullish Divergence: This occurs when the price of an asset forms lower lows while the Oscillator generates higher lows. It suggests that momentum might be building for a bullish reversal, even though the price continues to decrease.
- Regular Bearish Divergence: In contrast, regular bearish divergence emerges when the price forms higher highs while the Oscillator creates lower highs. This can indicate that despite the rising price, momentum might be waning, potentially heralding a bearish reversal.
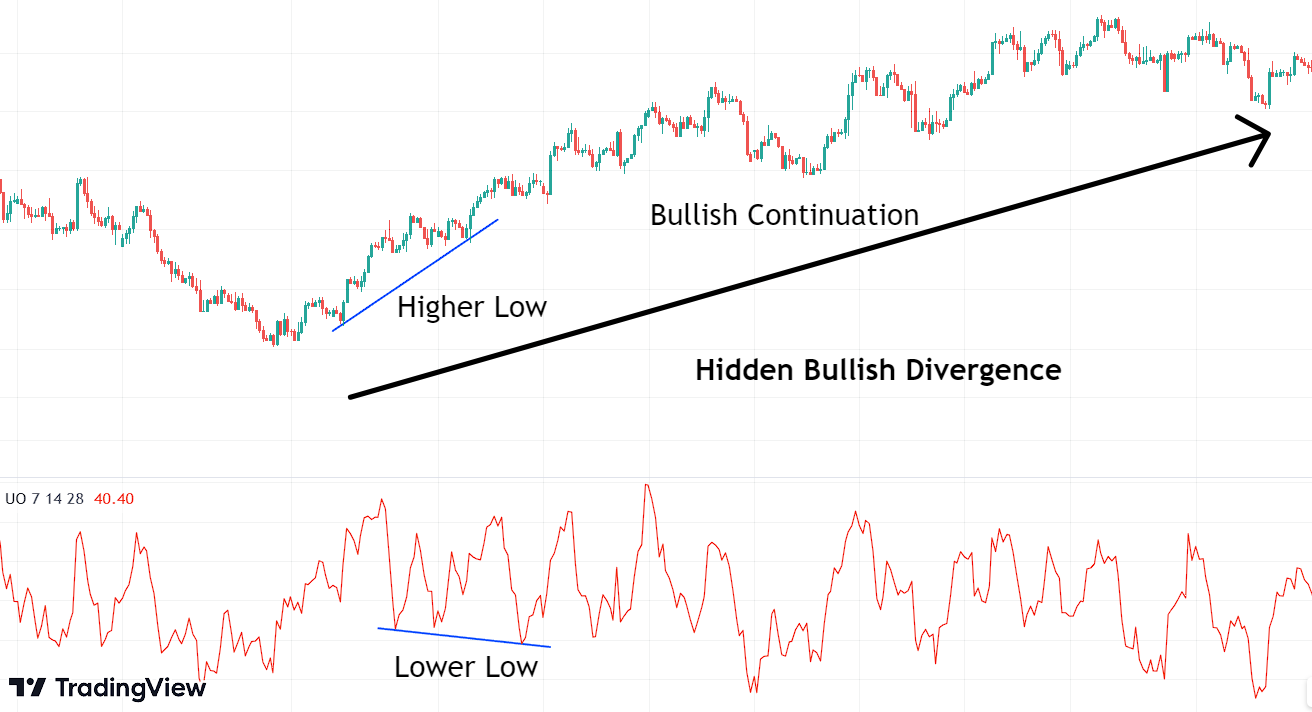
- Hidden Bullish Divergence: Hidden bullish divergence occurs when the price forms higher lows while the Oscillator generates lower lows. This type is often observed during a minor pullback within an overall uptrend, suggesting the potential continuation of the bullish trend.
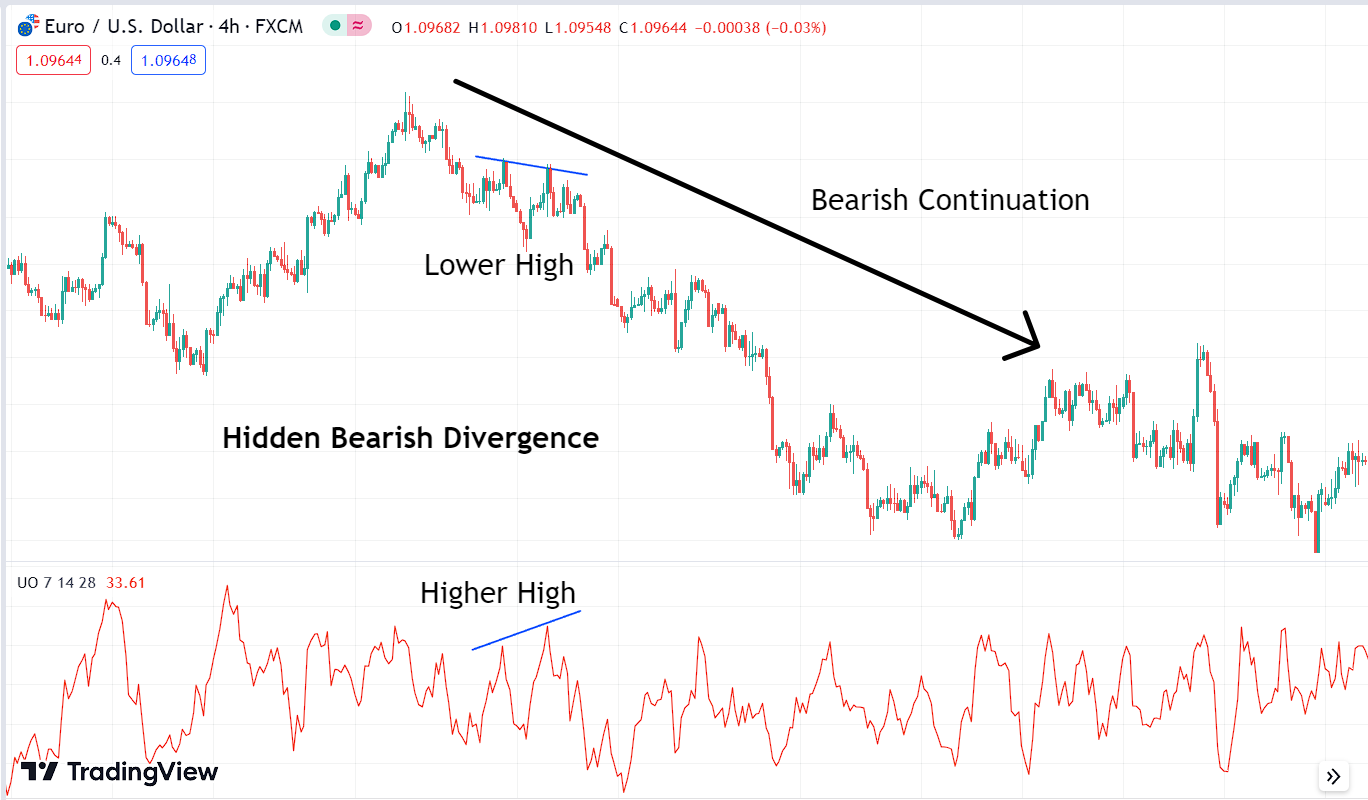
- Hidden Bearish Divergence: Hidden bearish divergence appears when the price forms lower highs while the Oscillator generates higher highs. This can suggest that even though there is a temporary price rise, momentum might be decreasing, hinting at a potential bearish continuation.
Using Ultimate Oscillator with Tradingview:
Goto Indicators, then search for ” Ultimate Oscillator.” Click on the name of indicator to insert it into chart

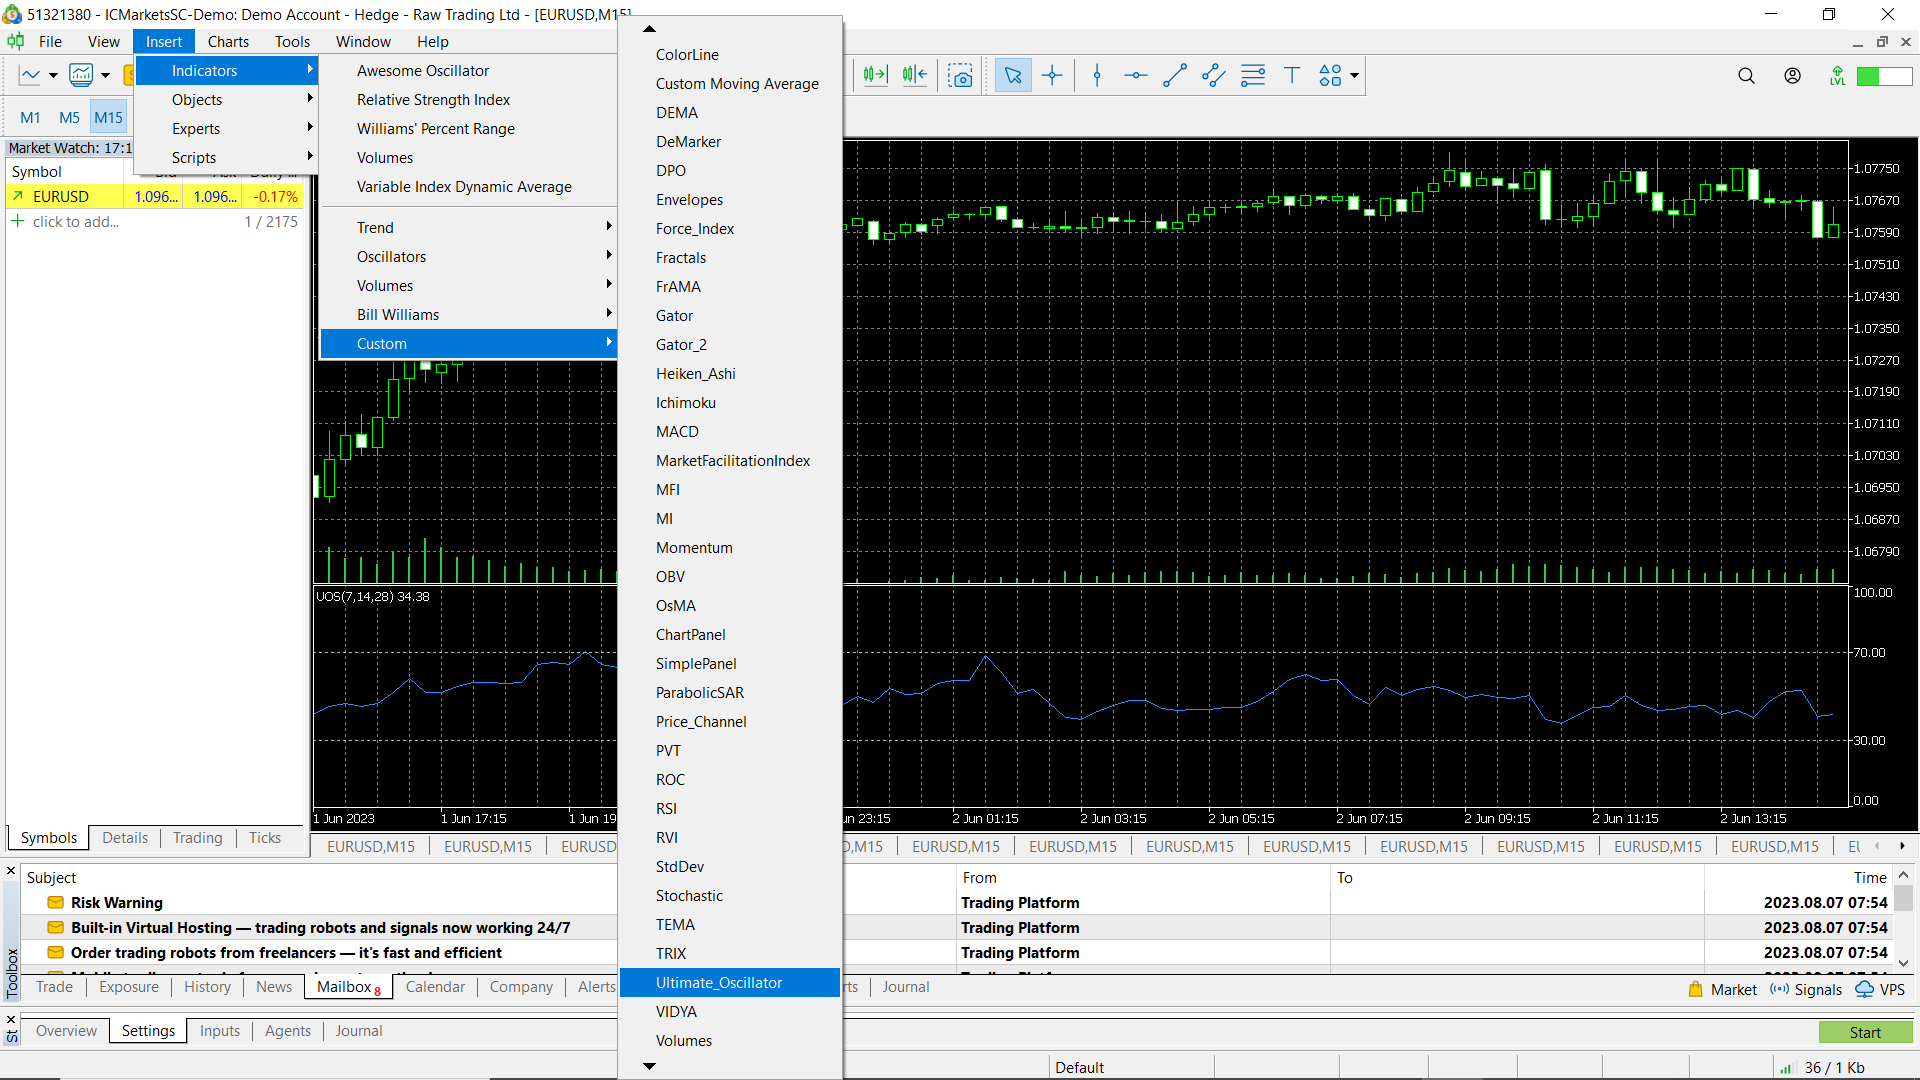
Using Ultimate Oscillator with MetaTrader 5 (MT5):
Open Meta Trader. Then Insert > Indicators > Custom > Ultimate Oscillator
Conclusion:
In summary, the Ultimate Oscillator is a technical indicator used to gauge market momentum by integrating data from multiple timeframes. Its applications include identifying divergence, confirming trends, and signaling overbought or oversold conditions. However, its effectiveness may vary in certain market conditions. To use it effectively, traders should consider it alongside other indicators, practice risk management, and remain aware of overall market trends.
Explore Our Algorithmic Trading Courses: