Introduction to Volume Weighted Average Price (VWAP):
Volume-weighted average price (VWAP) represents the average price of an asset during a trading session. It uses price and volume data to calculate the average, continuously averaging throughout the trading session and resets at the beginning of a new trading session. This indicator was developed in the 1980s and is commonly used by large institutional traders and hedge funds to inform their trading decisions.
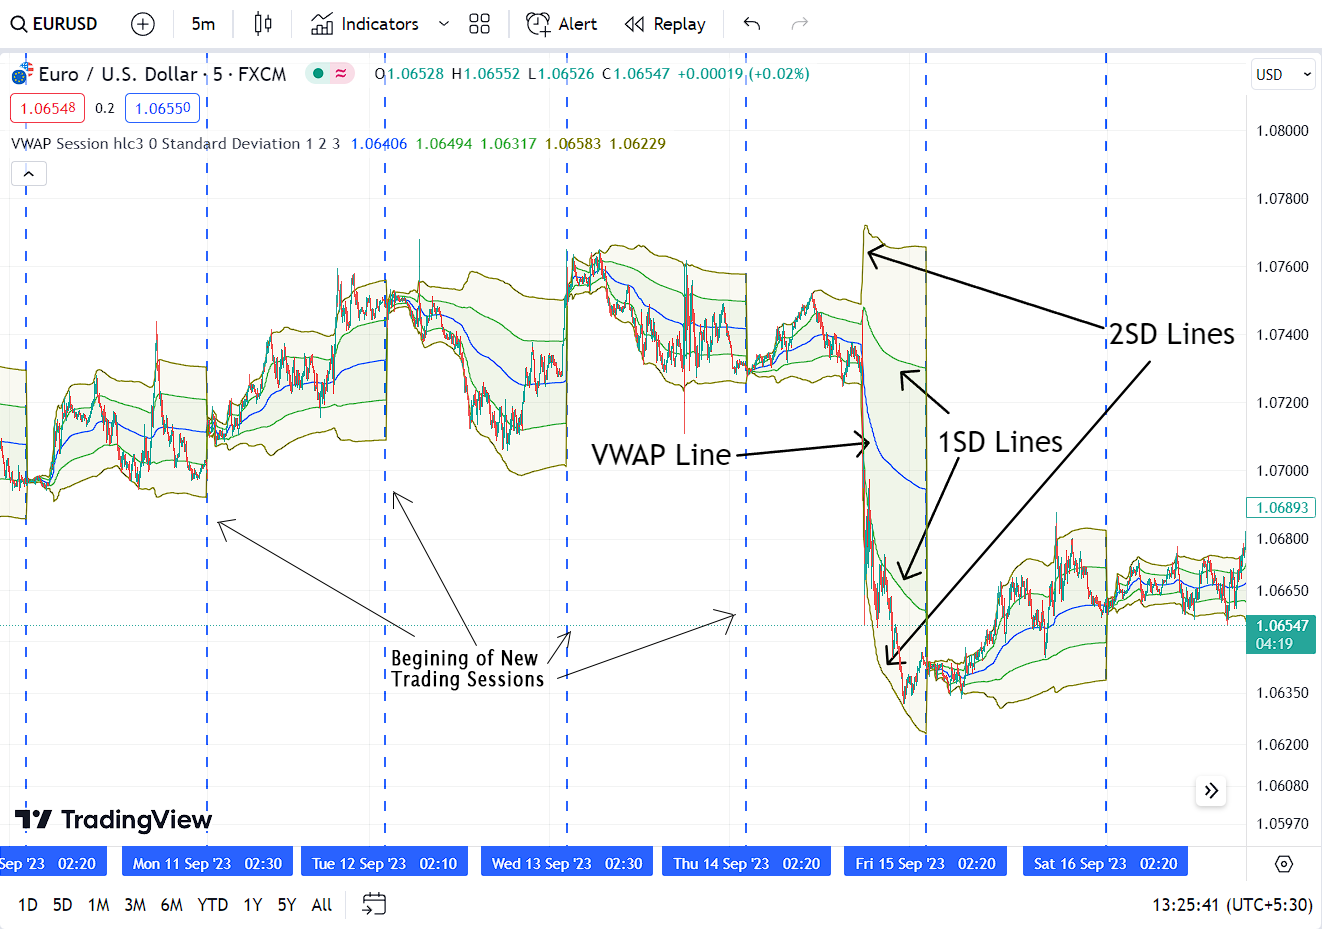
In the screenshot below, you can see how it looks in TradingView.
Vertical dashed lines indicate the beginning of a new trading session, the blue-colored center line represents the VWAP, and the green and black lines represent the 1 and 2 standard deviations from the center, respectively.
Calculating the Volume-Weighted Average Price (VWAP) – The Formula:
VWAP =∑(Typical Price× Volume)/∑ Volume
By using this formula, VWAP is continuously updated for each closing candle throughout the trading session. So, the value of this indicator depends on the time frame, and it is only calculated on intraday timeframes.
For example, let’s calculate the VWAP for a hypothetical stock over a trading session:
- Candle 1: Typical Price = $100, Volume = 10,000 shares
- Candle 2: Typical Price = $101, Volume = 5,000 shares
- Candle 3: Typical Price = $102, Volume = 8,000 shares
- Candle 4: Typical Price = $103, Volume = 12,000 shares
VWAP = (100×10,000)+(101×5,000)+(102×8,000)+(103×12,000)/(10,000+5,000+8,000+12,000)
= (1,000,000+505,000+816,000+1,236,000)/35,000
≈ $101.63
Note: In higher time frames, VWAP is less deviated from the price chart, and the standard deviation is low (because it is calculated for a small number of candles during the trading session). However, it is more deviated from the price chart, and the standard deviation is high in smaller time frames (because it is calculated for a large number of candles during the trading session). You can observe this difference in the following two screenshots.


VWAP vs Moving Averages (SMA/EMA):
When comparing VWAP to other types of moving averages like Simple Moving Average (SMA) and Exponential Moving Average (EMA), the main difference is that VWAP takes into account both volume and price in its calculation, whereas other moving averages are calculated using only price.
The other difference between these indicators is that VWAP is reset and calculated from the beginning at the start of a new trading session, while other moving averages (SMA/EMA) are not reset and are continuously calculated over a given period (e.g., 14 periods).
When comparing VWAP with the Exponential Moving Average (EMA), EMA reacts more quickly to recent price changes, while VWAP reacts more rapidly to price changes accompanied by higher volume.
Trading Strategies with the VWAP:
If the current price falls below the VWAP, it indicates that the price is below the average trading price for the current trading session, presenting a favorable opportunity to purchase a significant number of stocks at a fair price.
Conversely, if the current price is above the VWAP, it signifies that the current price is higher than the average trading price for the current trading session, offering a favorable opportunity to sell a substantial number of stocks at a good price.
So, when scalping, most of the time (except during strong uptrends and strong downtrends), we can use this indicator for a mean reversion strategy. If the price deviates too far from the indicator, there is a chance that the price will revert back towards the indicator due to the buying or selling activity of large institutional traders.
If the price is significantly above the indicator, there is a chance that it will fall back to the indicator level due to selling pressure from large institutional traders. Conversely, if the price is significantly below the indicator, there is a chance that it will return to the indicator level due to buying pressure from large institutional traders.
In the screenshot below, you can see an example of a mean reversion strategy. The price has returned to the center six times during the trading session. However, it’s important to keep in mind that sometimes the price can move in a certain direction without returning to the center.

Using VWAP Indicator with the Trading View:
Goto Indicators , then search for ” Volume Weighted Average Price”. Then click on the name of indicator to insert it into the chart.

Limitations of Using VWAP:
- Accuracy Dependency on Volume Data Quality: Since VWAP is calculated using volume data, the accuracy of this indicator relies on the quality of the volume data available in the charting platforms. Sometimes, users may need to pay an additional price for accurate real-time volume data.
- Local vs. Global Volume Consideration: Another challenge is that the indicator is calculated using volume data on the current trading platform, and there is no way to consider the global trading volume. For example, when calculating VWAP for EUR/USD, it is based on the trading volume provided by the broker rather than utilizing global trading volume. These two issues are the primary limitations of using this indicator.
- In strong uptrends or downtrends, prices can continuously move in a certain direction without crossing the midline. In these situations, if one waits to buy below VWAP and sell above VWAP, there is a chance of missing the opportunity to catch the trend at the beginning.
Conclusion:
Volume Weighted Average Price is a special type of moving average calculated using both price and trading volume. Consequently, the accuracy of this indicator can depend on the quality of volume data available on the charting platform. In many cases, large institutional traders employ this indicator for asset valuation.
When the price falls below the indicator, they consider the asset undervalued and buy in larger quantities. Conversely, when the price is above the indicator, they view the asset as overvalued and sell in larger quantities. Because of their significant trade volumes, even small price changes are crucial for them. However, it’s important to note that this approach may not hold true in strong uptrends or downtrends. Hence, it is important not to rely solely on a single indicator and instead use multiple confirmations when entering trades.
References:
Maximum Trading Gains With Anchored VWAP The Perfect Combination of Price, Time Volume (Brian Shannon) (Z-Library). (n.d.).
The VWAP Strategy (Volume Weighed Average Price) The Secret of Equilibrium Price Trading (Day Trading Book 2) (Gronowski Terence V.) (Z-Library). (n.d.).
Explore our Algorithmic Trading Courses: