Introduction to the Williams %R:
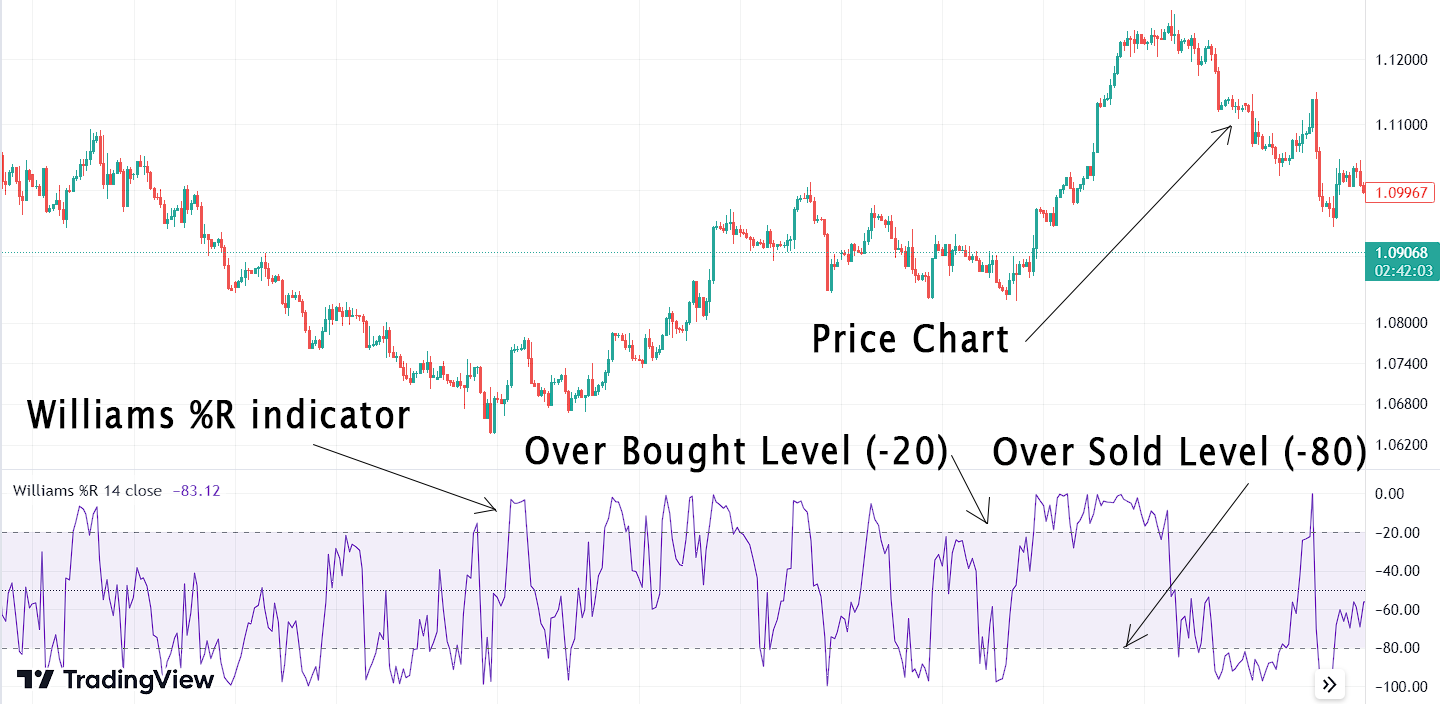
The Williams %R (Williams Percent Range) indicator, introduced by Larry Williams, is a momentum oscillator that identifies overbought and oversold market conditions. It calculates the percentage of the current closing price relative to the highest high and lowest low prices over a specific time frame (usually 14 periods). The indicator’s values range from 0 to -100, with upper and lower levels set at -20 and -80, respectively. Readings above -20 indicate overbought conditions, while readings below -80 suggest oversold conditions.
Calculation of the Williams %R – The Formula:
The Williams %R (Williams Percent Range) indicator is calculated using the following formula:
%R = (Highest High – Close) / (Highest High – Lowest Low) * -100
Let’s break down the components of the formula with an example:
Suppose we are analyzing a stock’s price movement over the past 14 periods (days), and we have the following data:
– Highest High: $75.00
– Lowest Low: $60.00
– Closing Price for the Current Period: $70.00
Now, let’s plug these values into the formula:
%R = ($75.00 – $70.00) / ($75.00 – $60.00) * -100
%R = $5.00 / $15.00 * -100
%R = 0.3333 * -100
%R = -33.33
In this example, the Williams %R indicator value is calculated to be approximately -33.33.
As a reminder, the %R values range from 0 (closest to the highest high) to -100 (closest to the lowest low). Readings above -20 are often seen as overbought, and readings below -80 are considered oversold, potentially signaling reversal points in the market trend.
Interpreting Williams %R:
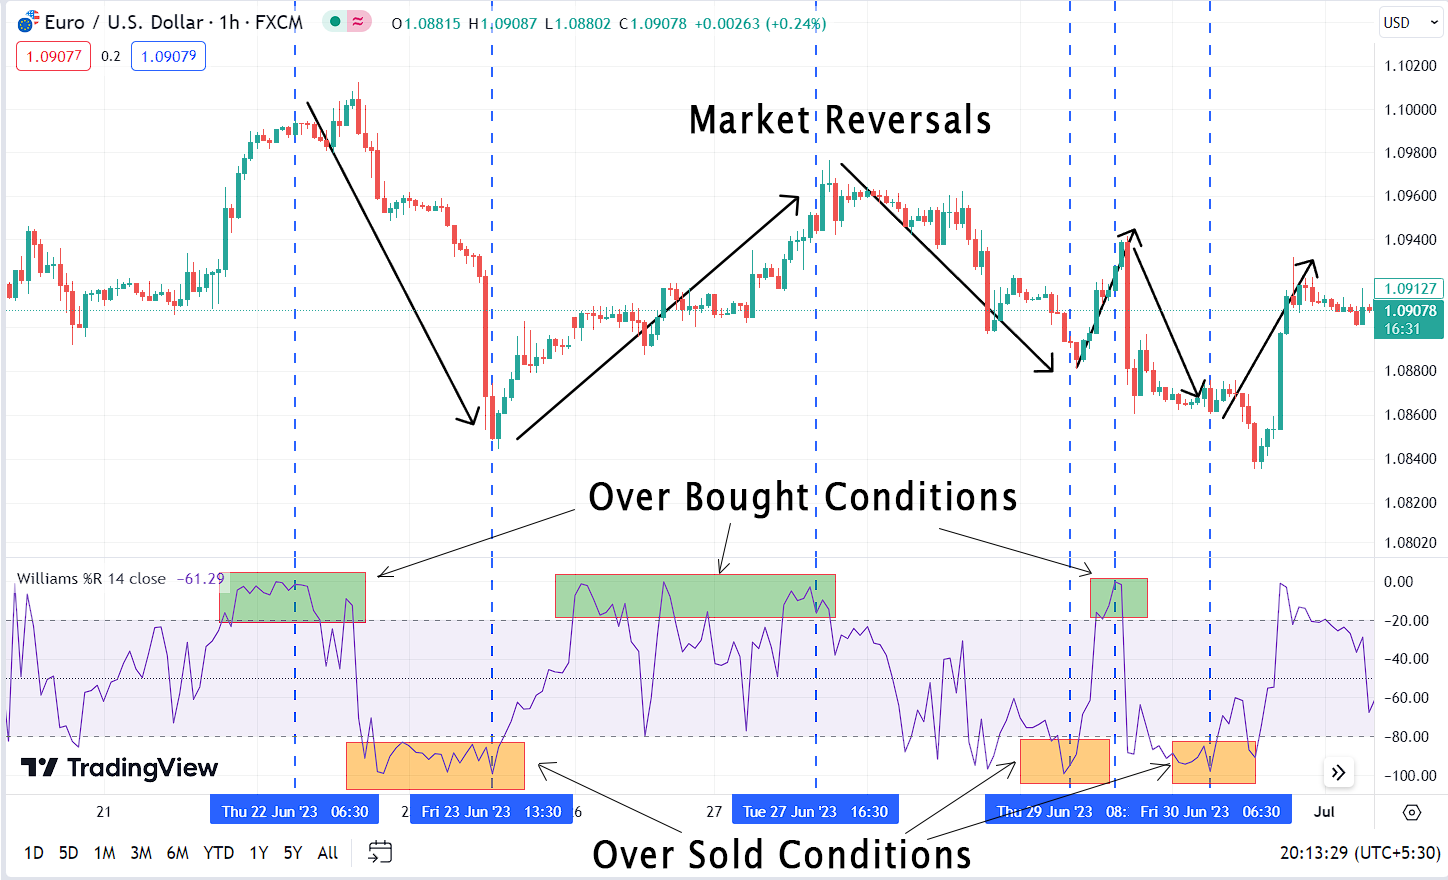
The Williams %R indicator fluctuates between 0 and -100. Readings above -20 typically suggest an overbought condition, indicating that the market may be due for a downward correction. Conversely, readings below -80 indicate an oversold condition, suggesting a potential upward reversal.
Spotting Divergence with the Williams %R:
Divergence occurs when there is a discrepancy between the price movement of an asset and the movement of the Oscillator. This phenomenon can signal potential reversals in market direction.
There are four primary types of divergence that traders commonly watch for:
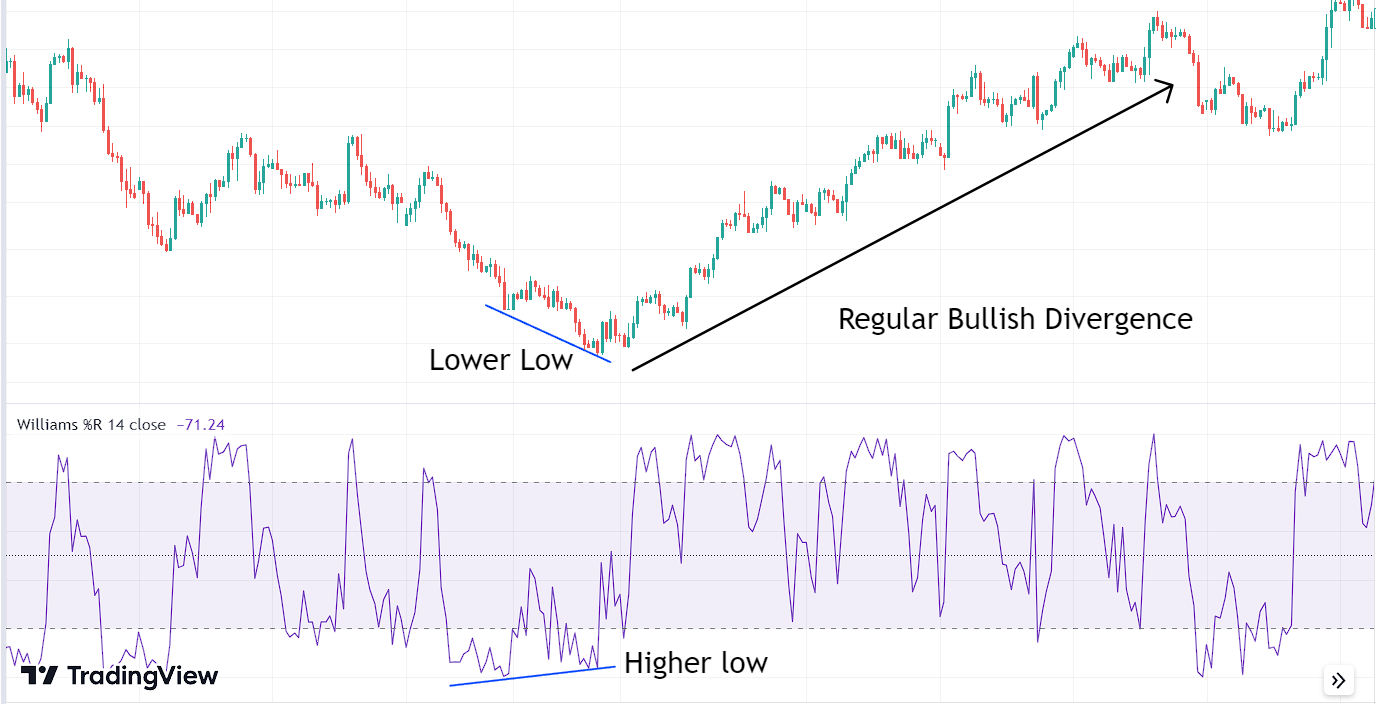
- Regular Bullish Divergence: This occurs when the price of an asset forms lower lows while the Oscillator generates higher lows. It suggests that momentum might be building for a bullish reversal, even though the price continues to decrease.
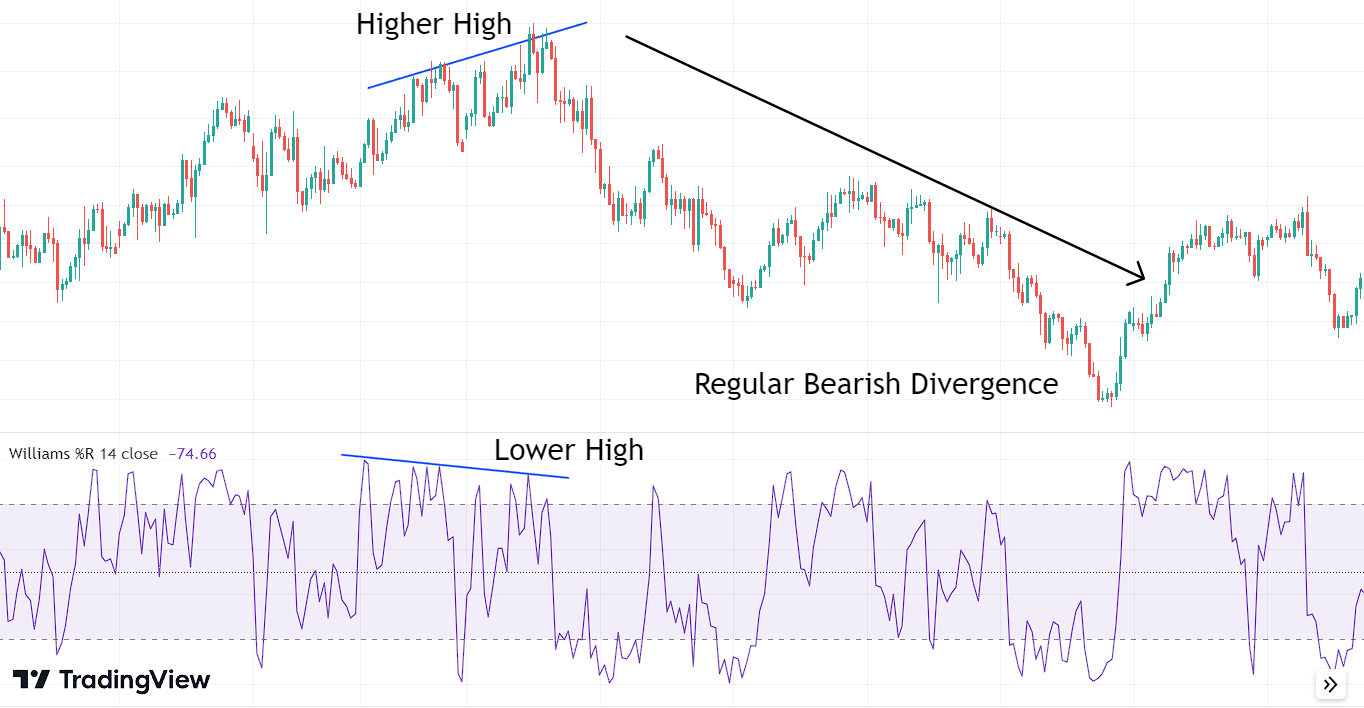
- Regular Bearish Divergence: In contrast, regular bearish divergence emerges when the price forms higher highs while the Oscillator creates lower highs. This can indicate that despite the rising price, momentum might be waning, potentially heralding a bearish reversal.
- Hidden Bullish Divergence: Hidden bullish divergence occurs when the price forms higher lows while the Oscillator generates lower lows. This type is often observed during a minor pullback within an overall uptrend, suggesting the potential continuation of the bullish trend.
- Hidden Bearish Divergence: Hidden bearish divergence appears when the price forms lower highs while the Oscillator generates higher highs. This can suggest that even though there is a temporary price rise, momentum might be decreasing, hinting at a potential bearish continuation.
Williams %R vs Stochastic Oscillator:
Williams %R and the Stochastic Oscillator are two momentum oscillators used by traders for assessing market conditions and spotting trading opportunities. Williams %R, focuses on determining overbought and oversold levels within a range of 0 to -100. It reacts swiftly to price changes, making it suitable for short-term traders. Conversely, the Stochastic Oscillator, compares recent closing prices to a selected range over a specified timeframe, producing smoother signals and catering to those interested in longer-term trends. Both tools help traders identify potential reversals and market momentum, with the choice between them dependent on trading style and market characteristics.
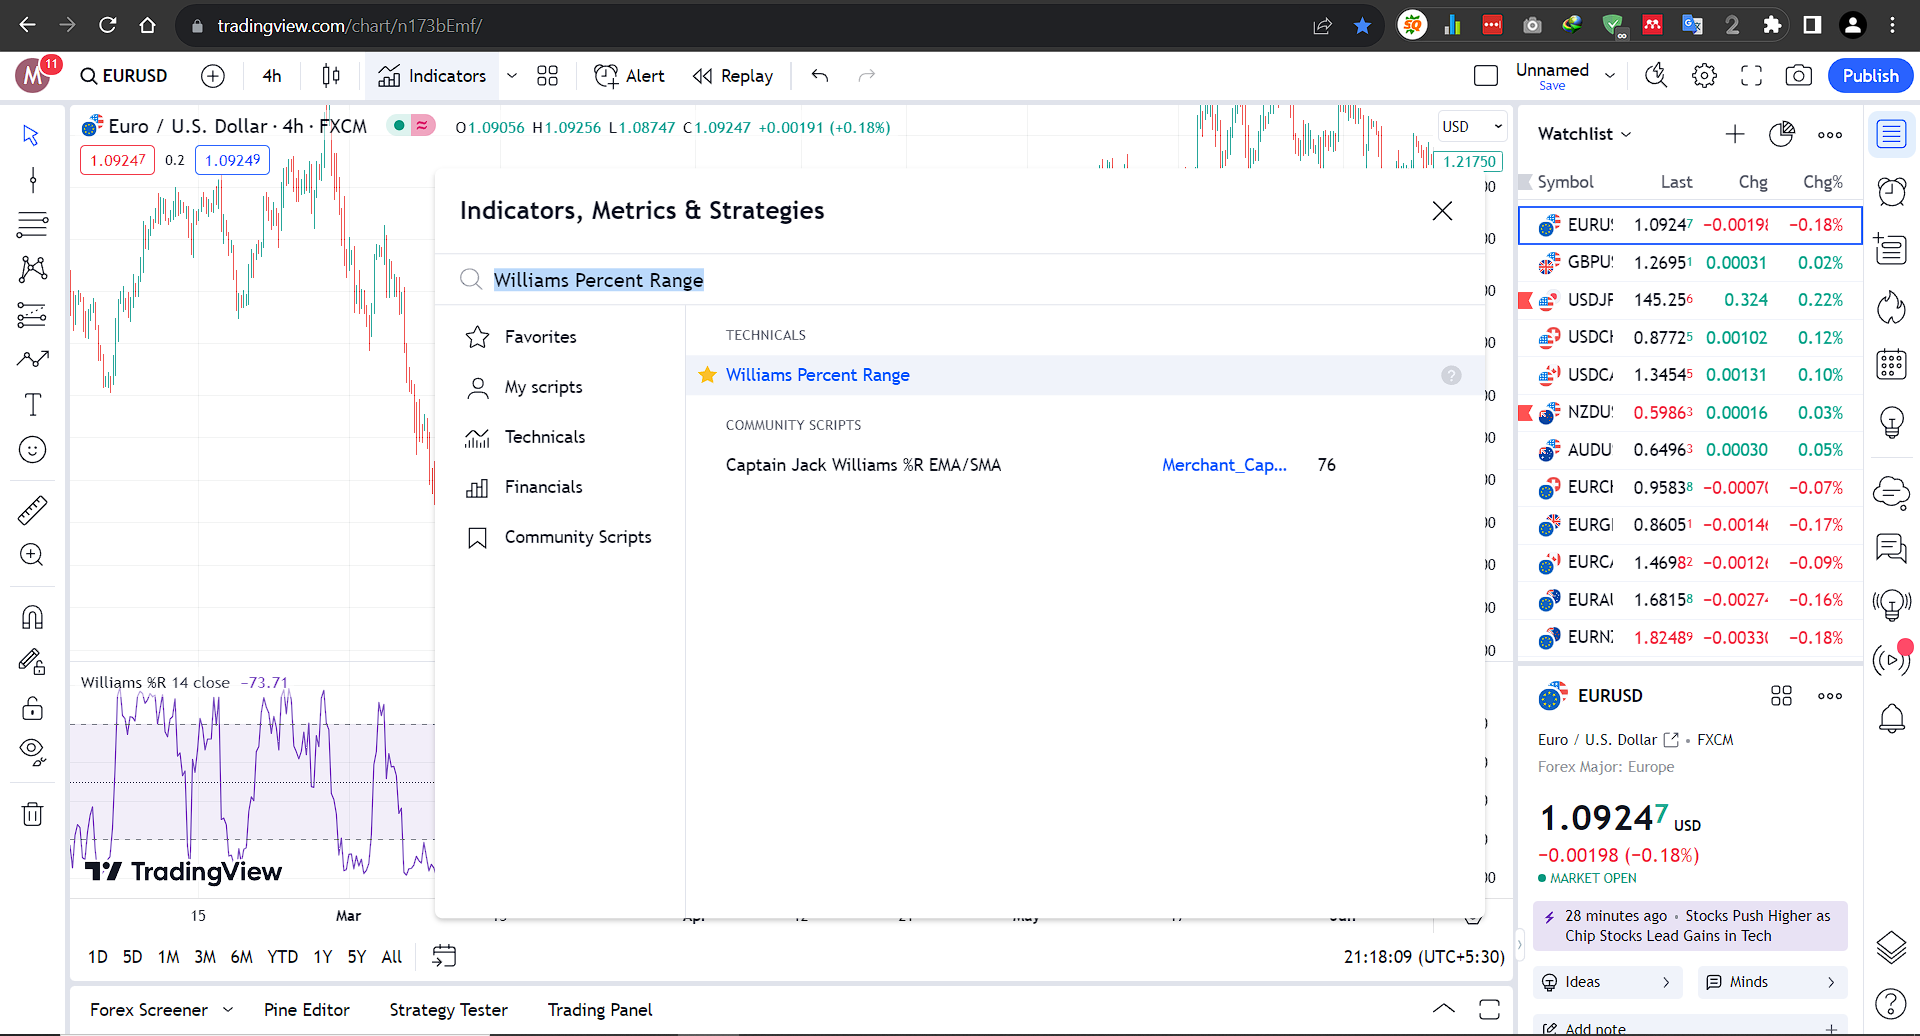
Using Williams % Rwith Tradingview:
Goto Indicators, then search for “Williams Percent Range .” Click on the name of indicator to insert it into chart
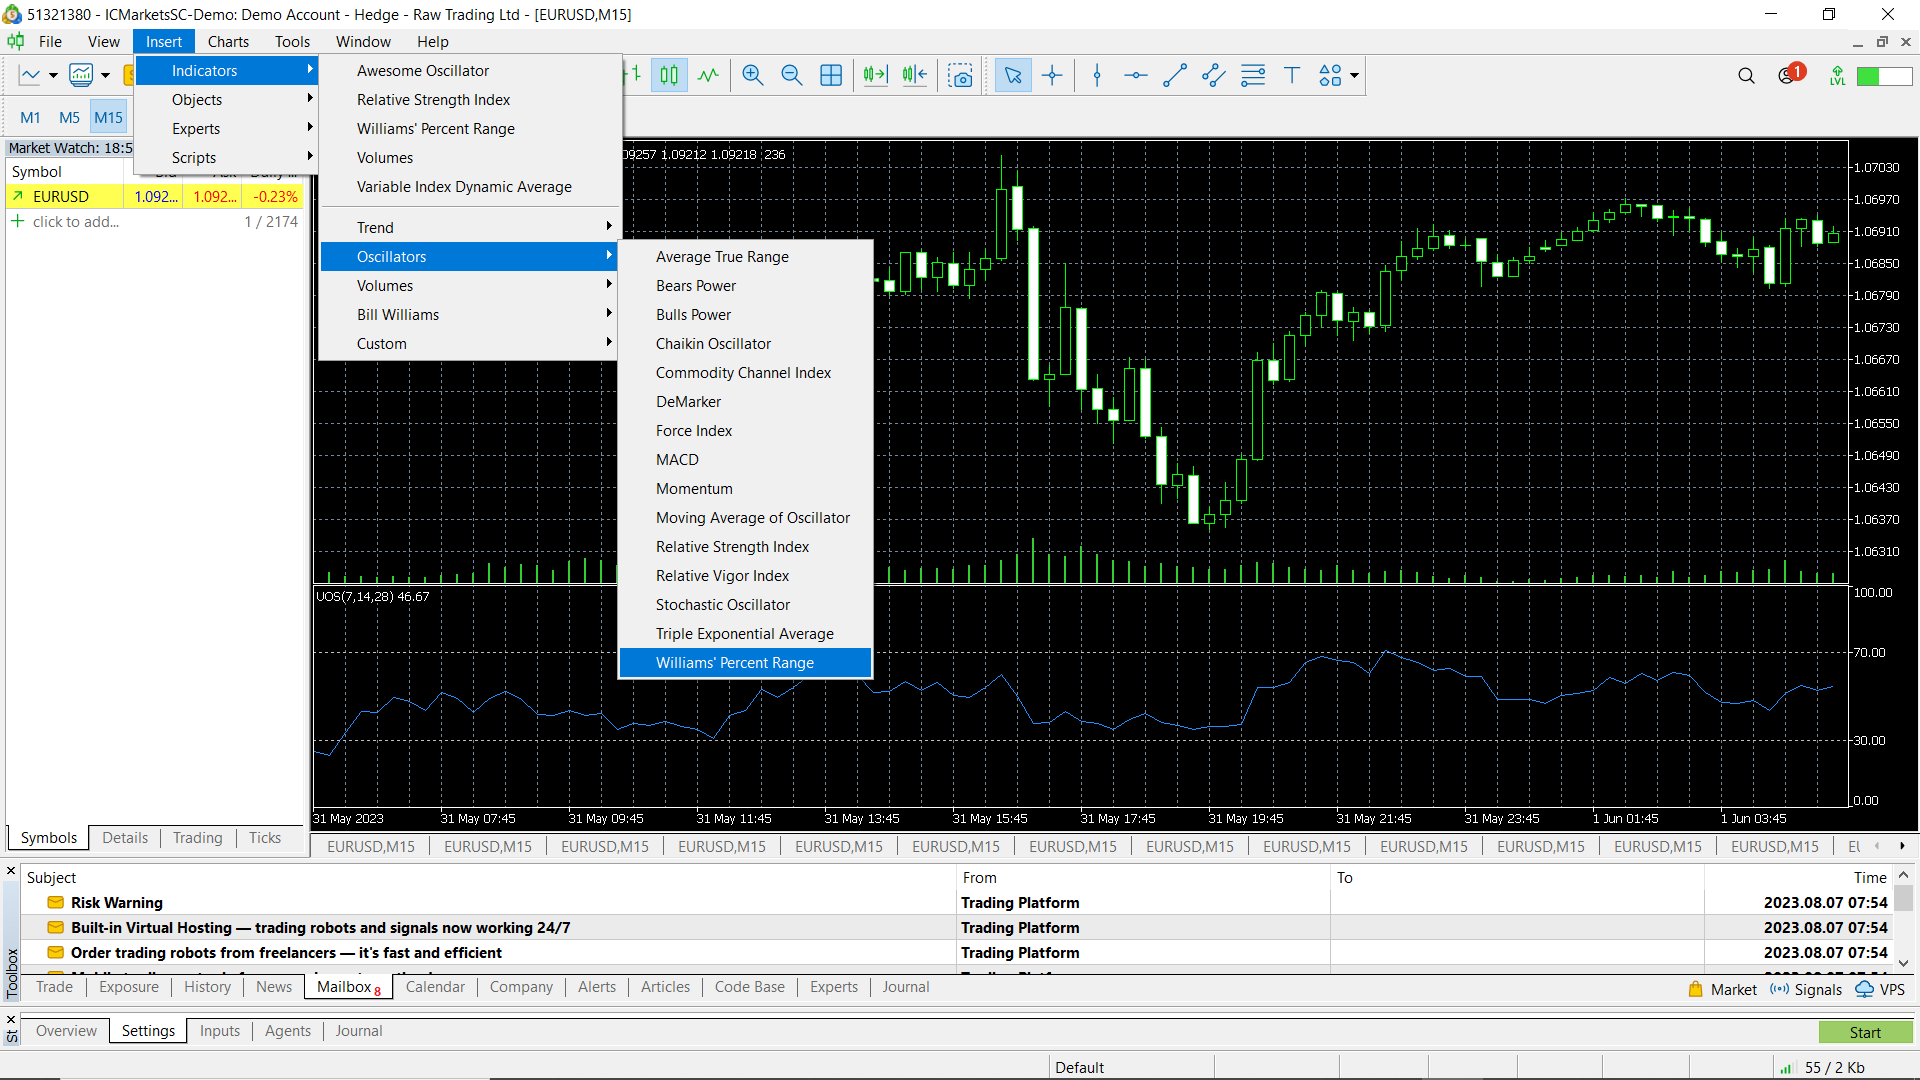
Using Stochastic Oscillator with MetaTrader 5 (MT5):
Open Meta Trader. Then Insert > Indicators > Oscillators > Williams Percent Range
Conclusion:
In summary, the Williams Percent Range (Williams %R) serves as a powerful asset in technical analysis, particularly suited for short-term traders aiming to swiftly detect overbought and oversold conditions. However, caution is advised due to its sensitivity, which can lead to false signals, and its potential limitations in identifying longer-term trends. When used judiciously alongside other indicators, the Williams %R can provide valuable insights, guiding traders through the complexities of financial markets.
Explore Our Algorithmic Trading Courses: